Authored by Ari Ekmekji
Organizations speak of operational reporting and analytics as the next technical challenge in improving business processes and efficiency. In a world where everyone is becoming an analyst, live dashboards surface up-to-date insights and operationalize real-time data to provide in-time decision-making support across multiple areas of an organization. We’ll look at what it takes to build operational dashboards and reporting using standard data visualization tools, like Tableau, Grafana, Redash, and Apache Superset. Specifically, we’ll be focusing on using these BI tools on data stored in DynamoDB, as we have found the path from DynamoDB to data visualization tool to be a common pattern among users of operational dashboards.
Creating data visualizations with existing BI tools, like Tableau, is probably a good fit for organizations with fewer resources, less strict UI requirements, or a desire to quickly get a dashboard up and running. It has the added benefit that many analysts at the company are already familiar with how to use the tool. We consider several approaches, all of which use DynamoDB Streams but differ in how the dashboards are served:
1. DynamoDB Streams + Lambda + Kinesis Firehose + Redshift
2. DynamoDB Streams + Lambda + Kinesis Firehose + S3 + Athena
3. DynamoDB Streams + Rockset
We’ll evaluate each approach on its ease of setup/maintenance, data latency, query latency/concurrency, and system scalability so you can judge which approach is best for you based on which of these criteria are most important for your use case.
Considerations for Building Operational Dashboards Using Standard BI Tools
Building live dashboards is non-trivial as any solution needs to support highly concurrent, low latency queries for fast load times (or else drive down usage/efficiency) and live sync from the data sources for low data latency (or else drive up incorrect actions/missed opportunities). Low latency requirements rule out directly operating on data in OLTP databases, which are optimized for transactional, not analytical, queries. Low data latency requirements rule out ETL-based solutions which increase your data latency above the real-time threshold and inevitably lead to “ETL hell”.
DynamoDB is a fully managed NoSQL database provided by AWS that is optimized for point lookups and small range scans using a partition key. Though it is highly performant for these use cases, DynamoDB is not a good choice for analytical queries which typically involve large range scans and complex operations such as grouping and aggregation. AWS knows this and has answered customers requests by creating DynamoDB Streams, a change-data-capture system which can be used to notify other services of new/modified data in DynamoDB. In our case, we’ll make use of DynamoDB Streams to synchronize our DynamoDB table with other storage systems that are better suited for serving analytical queries.
To build your live dashboard on top of an existing BI tool essentially means you need to provide a SQL API over a real-time data source, and then you can use your BI tool of choice–Tableau, Superset, Redash, Grafana, etc.–to plug into it and create all of your data visualizations on DynamoDB data. Therefore, here we’ll focus on creating a real-time data source with SQL support and leave the specifics of each of those tools for another post.
Kinesis Firehose + Redshift
We’ll start off this end of the spectrum by considering using Kinesis Firehose to synchronize your DynamoDB table with a Redshift table, on top of which you can run your BI tool of choice. Redshift is AWS’s data warehouse offering that is specifically tailored for OLAP workloads over very large datasets. Most BI tools have explicit Redshift integrations available, and there’s a standard JDBC connection to can be used as well.
The first thing to do is create a new Redshift cluster, and within it create a new database and table that will be used to hold the data to be ingested from DynamoDB. You can connect to your Redshift database through a standard SQL client that supports a JDBC connection and the PostgreSQL dialect. You will have to explicitly define your table with all field names, data types, and column compression types at this point before you can continue.
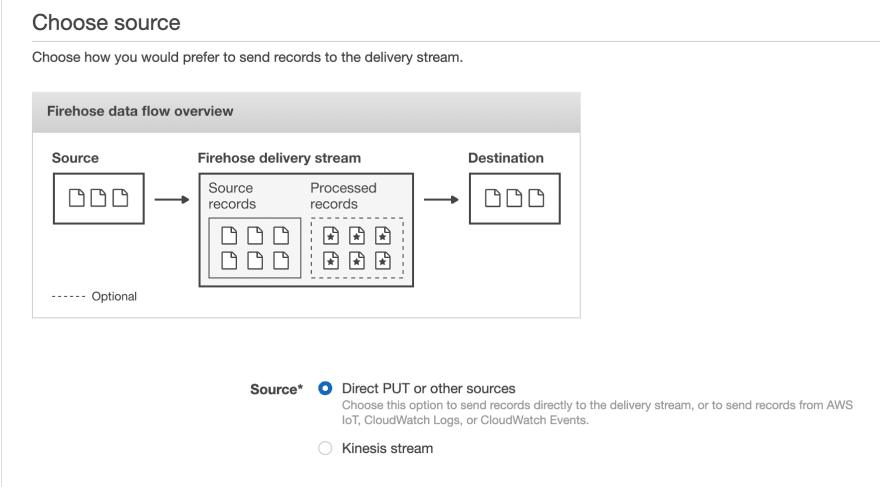
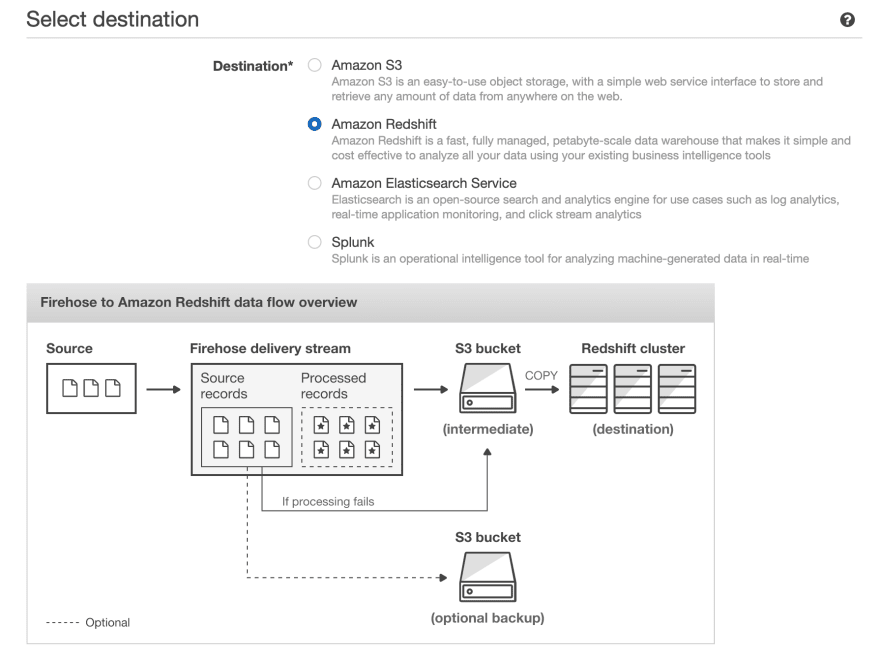
Next, you’ll need to go to the Kinesis dashboard and create a new Kinesis Firehose, which is the variant AWS provides to stream events to a destination bucket in S3 or a destination table in Redshift. We’ll choose the source option Direct PUT or other sources, and we’ll select our Redshift table as the destination. Here it gives you some helpful optimizations you can enable like staging the data in S3 before performing a COPY command into Redshift (which leads to fewer, larger writes to Redshift, thereby preserving precious compute resources on your Redshift cluster and giving you a backup in S3 in case there are any issues during the COPY). We can configure the buffer size and buffer interval to control how much/often Kinesis writes in one chunk. For example, a 100MB buffer size and 60s buffer interval would tell Kinesis Firehose to write once it has received 100MB of data, or 60s has passed, whichever comes first.
Finally, you can set up a Lambda function that uses the DynamoDB Streams API to retrieve recent changes to the DynamoDB table. This function will buffer these changes and send a batch of them to Kinesis Firehose using its PutRecord or PutRecordBatch API. The function would look something like
Putting this all together we get the following chain reaction whenever new data is put into the DynamoDB table:
- The Lambda function is triggered, and uses the DynamoDB Streams API to get the updates and writes them to Kinesis Firehose
- Kinesis Firehose buffers the updates it gets and periodically (based on buffer size/interval) flushes them to an intermediate file in S3
- The file in S3 is loaded into the Redshift table using the Redshift COPY command
- Any queries against the Redshift table (e.g. from a BI tool) reflect this new data as soon as the COPY completes
In this way, any dashboard built through a BI tool that is integrated with Redshift will update in response to changes in your DynamoDB table.
Pros:
- Redshift can scale to petabytes
- Many BI tools (e.g. Tableau, Redash) have dedicated Redshift integrations
- Good for complex, compute-heavy queries
- Based on familiar PostgreSQL; supports full-featured SQL, including aggregations, sorting, and joins
Cons:
- Need to provision/maintain/tune Redshift cluster which is expensive, time consuming, and quite challenging
- Data latency on the order of several minutes (or more depending on configurations)
- As the DynamoDB schema evolves, tweaks will be required to the Redshift table schema / the Lambda ETL
- Redshift pricing is by the hour for each node in the cluster, even if you’re not using them or there’s little data on them
- Redshift struggles with highly concurrent queries
TLDR:
- Consider this option if you don’t have many active users on your dashboard, don’t have strict real-time requirements, and/or already have a heavy investment in Redshift
- This approach uses Lambdas and Kinesis Firehose to ETL your data and store it in Redshift
- You’ll get good query performance, especially for complex queries over very large data
- Data latency won’t be great though and Redshift struggles with high concurrency
- The ETL logic will probably break down as your data changes and need fixing
- Administering a production Redshift cluster is a huge undertaking
For more information on this approach, check out the AWS documentation for loading data from DynamoDB into Redshift.
S3 + Athena
Next we’ll consider Athena, Amazon’s service for running SQL on data directly in S3. This is primarily targeted for infrequent or exploratory queries that can tolerate longer runtimes and save on cost by not having the data copied into a full-fledged database or cache like Redshift, Redis, etc.
Much like the previous section, we will use Kinesis Firehose here, but this time it will be used to shuttle DynamoDB table data into S3. The setup is the same as above with options for buffer interval and buffer size. Here it is extremely important to enable compression on the S3 files since that will lead to both faster and cheaper queries since Athena charges you based on the data scanned. Then, like the previous section, you can register a Lambda function and use the DynamoDB streams API to make calls to the Kinesis Firehose API as changes are made to our DynamoDB table. In this way you will have a bucket in S3 storing a copy of your DynamoDB data over several compressed files.
Note: You can additionally save on cost and improve performance by using a more optimized storage format and partitioning your data.
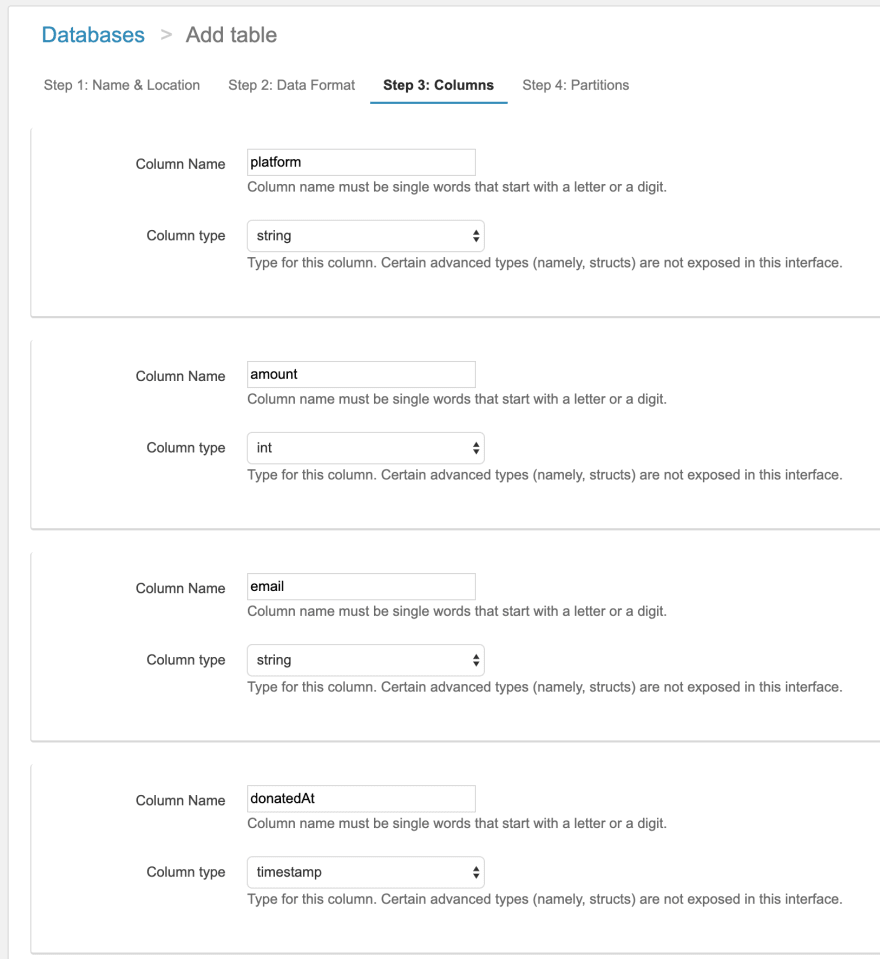
Next in the Athena dashboard you can create a new table and define the columns there either through the UI or using Hive DDL statements. Like Hive, Athena has a schema on read system, meaning as each new record is read in, the schema is applied to it (vs. being applied when the file is written).
Once your schema is defined, you can submit queries through the console, through their JDBC driver, or through BI tool integrations like Tableau and Amazon Quicksight. Each of these queries will lead to your files in S3 being read, the schema being applied to all of records, and the query result being computed across the records. Since the data is not optimized in a database, there are no indexes and reading each record is more expensive since the physical layout is not optimized. This means that your query will run, but it will take on the order of minutes to potentially hours.
Pros:
- Works at large scales
- Low data storage costs since everything is in S3
- No always-on compute engine; pay per query
Cons:
- Very high query latency– on the order of minutes to hours; can’t use with interactive dashboards
- Need to explicitly define your data format and layout before you can begin
- Mixed types in the S3 files caused by DynamoDB schema changes will lead to Athena ignoring records that don’t match the schema you specified
- Unless you put in the time/effort to compress your data, ETL your data into Parquet/ORC format, and partition your data files in S3, queries will effectively always scan your whole dataset, which will be very slow and very expensive
TLDR:
- Consider this approach if cost and data size are the driving factors in your design and only if you can tolerate very long and unpredictable run times (minutes to hours)
- This approach uses Lambda + Kinesis Firehose to ETL your data and store it in S3
- Best for infrequent queries on tons of data and DynamoDB reporting / dashboards that don't need to be interactive
Take a look at this AWS blog for more details on how to analyze data in S3 using Athena.
Rockset
The last option we’ll consider in this post is Rockset, a serverless search and analytics service. Rockset’s data engine has strong dynamic typing and smart schemas which infer field types as well as how they change over time. These properties make working with NoSQL data, like that from DynamoDB, straight forward. Rockset also integrates with both custom dashboards and BI tools.
After creating an account at www.rockset.com, we’ll use the console to set up our first integration– a set of credentials used to access our data. Since we’re using DynamoDB as our data source, we’ll provide Rockset with an AWS access key and secret key pair that has properly scoped permissions to read from the DynamoDB table we want. Next we’ll create a collection– the equivalent of a DynamoDB/SQL table– and specify that it should pull data from our DynamoDB table and authenticate using the integration we just created. The preview window in the console will pull a few records from the DynamoDB table and display them to make sure everything worked correctly, and then we are good to press “Create”.
Soon after, we can see in the console that the collection is created and data is streaming in from DynamoDB. We can use the console’s query editor to experiment/tune the SQL queries that will be used in our live dashboard. Since Rockset has its own query compiler/execution engine, there is first-class support for arrays, objects, and nested data structures.
Next, we can create an API key in the console which will be used by the dashboard for authentication to Rockset’s servers. Our options for connecting to a BI tool like Tableau, Redash, etc. are the JDBC driver that Rockset provides or the native Rockset integration for those that have one.
We've now successfully gone from DynamoDB data to a fast, interactive dashboard on Tableau, or other BI tool of choice. Rockset’s cloud-native architecture allows it to scale query performance and concurrency dynamically as needed, enabling fast queries even on large datasets with complex, nested data with inconsistent types.
Pros:
- Serverless– fast setup, no-code DynamoDB integration, and 0 configuration/management required
- Designed for low query latency and high concurrency out of the box
- Integrates with DynamoDB (and other sources) in real-time for low data latency with no pipeline to maintain
- Strong dynamic typing and smart schemas handle mixed types and works well with NoSQL systems like DynamoDB
- Integrates with a variety of BI tools (Tableau, Redash, Grafana, Superset, etc.) and custom dashboards (through client SDKs, if needed)
Cons:
- Optimized for active dataset, not archival data, with sweet spot up to 10s of TBs
- Not a transactional database
- It’s an external service
TLDR:
- Consider this approach if you have strict requirements on having the latest data in your real-time dashboards, need to support large numbers of users, or want to avoid managing complex data pipelines
- Built-in integrations to quickly go from DynamoDB (and many other sources) to live dashboards
- Can handle mixed types, syncing an existing table, and tons of fast queries
- Best for data sets from a few GBs to 10s of TBs
For more resources on how to integrate Rockset with DynamoDB, check out this blog post that walks through a more complex example.
Conclusion
In this post, we considered a few approaches to enabling standard BI tools, like Tableau, Redash, Grafana, and Superset, for real-time dashboards on DynamoDB, highlighting the pros and cons of each. With this background, you should be able to evaluate which option is right for your use case, depending on your specific requirements for query and data latency, concurrency, and ease of use, as you implement operational reporting and analytics in your organization.


Top comments (0)