ML.NET and Python Simple Regression

Why even bother with ML.NET
ML.NET has been around for a few years now, and yet the community excitement has been muted. Don't get me wrong, it definitely exists - but on the whole the sentiment is that this has been solved in other languages so why bother with ML.NET.
This is valid, but it ignores the many companies where the outcomes that can be achieved from machine learning are a goal, but they don't necessarily want to start creating and maintaining a bunch of Python projects. Companies that have invested in the .NET stack should look to ML.NET for as an alternative - but how close is it?
I'll be examining that in a series of blogs.
First things first, get set up with Jupyter Notebooks and the .NET runtime. Setup Jupyter Notebooks and .NET
Once you're all set up, lets take a look at the data.
The Data
Here is the data:
This data has two columns, years of experience and salary. The data suggests that there is a relationship between these two things - so we should be able to do a simple regression to predict a salary based on the years of experience.
Simple Regression in Python
First - how do we do this in Python?
First we need to import the necessary files.
import matplotlib.pyplot as plt
import pandas as pd
Pandas will read in the data from the csv file while matplotlib will do the work of creating some graphs for us.
dataset = pd.read_csv('Salary_Data.csv')
X = dataset.iloc[:, :-1].values
y = dataset.iloc[:, -1].values
This is wonderful simplicity. The dataset is split into x and y axes using simple array syntax.
Next we import a function from sklearn in order to split the dataset into train and test sets.
from sklearn.model_selection import train_test_split
X_train, X_test, y_train, y_test = train_test_split(X, y, test_size = 1/3, random_state = 0)
Next we train the model. Again we use sklearn and import the simply named LinearRegression class in order to train the regressor model.
from sklearn.linear_model import LinearRegression
regressor = LinearRegression()
regressor.fit(X_train, y_train)
Now we can predict the test set results and store them into a variable.
y_pred = regressor.predict(X_test)
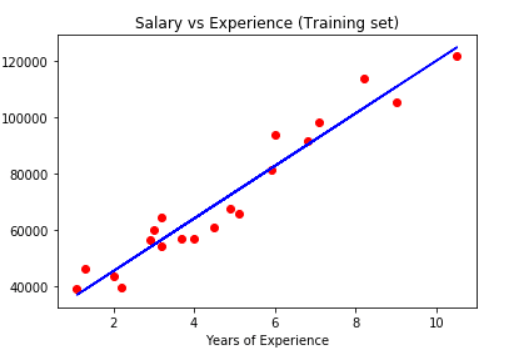
And we can use the matplotlib library to visualize the results from our training set.
plt.scatter(X_train, y_train, color = 'red')
plt.plot(X_train, regressor.predict(X_train), color = 'blue')
plt.title('Salary vs Experience (Training set)')
plt.xlabel('Years of Experience')
plt.ylabel('Salary')
plt.show()
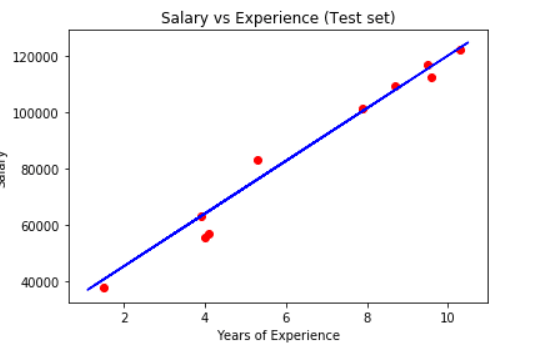
And finally, as we have the test prediction results we can now put those into a visualization and compare them to the actual data.
plt.scatter(X_test, y_test, color = 'red')
plt.plot(X_train, regressor.predict(X_train), color = 'blue')
plt.title('Salary vs Experience (Test set)')
plt.xlabel('Years of Experience')
plt.ylabel('Salary')
plt.show()
Simple Regression in ML.NET
And now how do we do the same simple regression in ML.NET?
You will notice some major differences here. ML.NET throws us a little further into the deep end. There are tools and support, but it's still a steeper learning curve than Python.
First things first, you have to install the nuget packages and set up the using statements. From a practical standpoint this is almost identical to Python. Jupyter Notebook has a special way to get a nuget package to download in a code block. All that has to be done is setting up a #r followed by nuget: and then the full name of the nuget package followed by a comma and the version desired. See below to see an example.
// ML.NET Nuget packages installation
#r "nuget:Microsoft.ML,1.5.0"
#r "nuget:Microsoft.ML.Mkl.Components,1.5.0"
//Install XPlot package
#r "nuget:XPlot.Plotly,2.0.0"
using Microsoft.ML;
using Microsoft.ML.Data;
using XPlot.Plotly;
using System;
using System.Linq;
This works just fine when running from a local Jupyter Notebook, but on Binder the nuget download has to be attempted twice and always works on the second time.
Now, unlike Python where we could immediately pull in the data we have to setup some classes. As C# is a strongly typed language we will have classes to model the data we'll be working with. This is a bit more effort for setup, but placed me squarely in my comfort zone.
public class ModelInput
{
    [ColumnName("YearsExperience"), LoadColumn(0)]
    public float YearsExperience { get; set; }

    [ColumnName("Salary"), LoadColumn(1)]
    public float Salary { get; set; }
}

public class ModelOutput
{
    public float Score { get; set; }
}
Now that we've defined our classes we can move forward with loading in the data. ML.NET uses a class called MLContext in order to load in data and perform operations on it. This class is a sort of combination of pandas and sklearn from Python. MLContext has a property called Data that can load the data from the csv file. It can also split the data up for us into training and test sets.
var mlContext = new MLContext(seed: 1);

IDataView trainingDataView = mlContext.Data.LoadFromTextFile<ModelInput>(
                                            path: "./Salary_Data.csv",
                                            hasHeader: true,
                                            separatorChar: ',',
                                            allowQuoting: true,
                                            allowSparse: false);

var split = mlContext.Data.TrainTestSplit(trainingDataView, testFraction: 0.2);
//split.TrainSet
//split.TestSet
Now Python has the matplotlib library which is a wonderful and versatile charting library. .NET has several libraries that can do similar things but require different contexts and setup. Luckily, FsLab has created something that works very well on Jupyter Notebooks called XPlot.
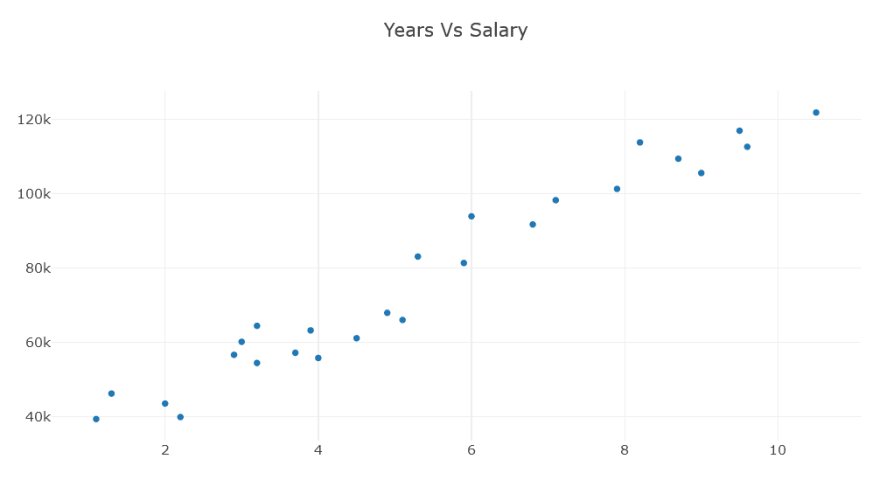
Here we see how to model the training data and create a scatter plot. Matplotlib can also create a regression line with only a few arguments but XPlot requires a bit more setup as we will see later.
var years = split.TrainSet.GetColumn<float>("YearsExperience").ToArray();
var salary = split.TrainSet.GetColumn<float>("Salary").ToArray();

var yearsChart = Chart.Plot(new Graph.Scatter
{
   x = years,
   y = salary,
   mode = "markers"
});

yearsChart.WithTitle("Years Vs Salary");
display(yearsChart);
Now at last we can create the pipeline which will allow us to train the model. A big difference here is the algorithm used. Where Python had the aptly named LinearRegression() class to handle this, we have a different experience with ML.NET. We are confronted with a bunch of confusingly named choices. For this, I chose to use the mlnet command line tool to analyze the dataset and and select the appropriate algorithm for me. This time it chose the Ols() algorithm. The command line tool does print comparitive metrics for each algorithm tested so you can view for yourself why it selected whichever algorithm it did.
I go over the command line tool a bit more in this post.
Also, unlike Python, you still have to define features even for this simple case in ML.NET.
var dataProcessPipeline = mlContext.Transforms.Concatenate("Features", new[] { "YearsExperience" })
                          .Append(mlContext.Transforms.NormalizeMinMax("Features", "Features"));
// Set the training algorithm
var trainer = mlContext.Regression.Trainers.Ols(labelColumnName: "Salary", featureColumnName: "Features");

// Build training pipeline
IEstimator<ITransformer> trainingPipeline = dataProcessPipeline.Append(trainer);
Now we can train our model. Python and ML.NET make this step almost comically easy.
ITransformer mlModel = trainingPipeline.Fit(split.TrainSet);
We can also now evaluate our pipeline. ML.NET has a method that will iterate over the validations a set amount of times (numberOfFolds) and then display the averaged results.
var crossValidationResults = mlContext.Regression.CrossValidate(trainingDataView, trainingPipeline, numberOfFolds: 5, labelColumnName: "Salary");
var L1 = crossValidationResults.Select(r => r.Metrics.MeanAbsoluteError);
var L2 = crossValidationResults.Select(r => r.Metrics.MeanSquaredError);
var RMS = crossValidationResults.Select(r => r.Metrics.RootMeanSquaredError);
var lossFunction = crossValidationResults.Select(r => r.Metrics.LossFunction);
var R2 = crossValidationResults.Select(r => r.Metrics.RSquared);

Console.WriteLine($" *************************************************************************************************************");
Console.WriteLine($"* Metrics for Regression model ");
Console.WriteLine($"*------------------------------------------------------------------------------------------------------------");
Console.WriteLine($"* Average L1 Loss: {L1.Average():0.###} ");
Console.WriteLine($"* Average L2 Loss: {L2.Average():0.###} ");
Console.WriteLine($"* Average RMS: {RMS.Average():0.###} ");
Console.WriteLine($"* Average Loss Function: {lossFunction.Average():0.###} ");
Console.WriteLine($"* Average R-squared: {R2.Average():0.###} ");
Console.WriteLine($" *************************************************************************************************************");

And now we can test our model and try some predictions. I believe there are more efficient ways to perform predictions over a bulk dataset than what I have done - but I'm familiar with Linq so I chose to use that to perform my predictions.
var predEngine = mlContext.Model.CreatePredictionEngine<ModelInput, ModelOutput>(mlModel);
var enumerableTestSet = mlContext.Data.CreateEnumerable<ModelInput>(split.TestSet, reuseRowObject: false)
        .Select(ts => new ModelInput() { YearsExperience = ts.YearsExperience });
var preductionResults = enumerableTestSet.Select(ts => predEngine.Predict(ts));

foreach (var predictionResult in preductionResults)
{
    Console.WriteLine($"\n\nPredicted Salary: {predictionResult.Score}\n\n");
}
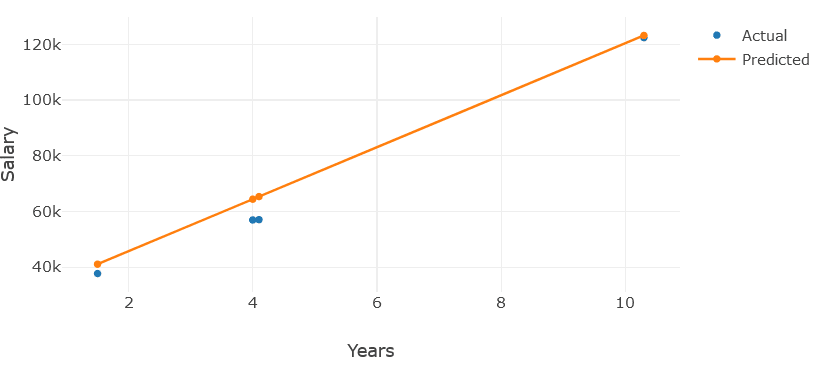
Lets put all of this into a chart next to the actual data. (At last, a regression line!)
var testYears = enumerableTestSet.Select(ts => ts.YearsExperience).ToArray();
var actualSalaries = mlContext.Data.CreateEnumerable<ModelInput>(split.TestSet, reuseRowObject: false).Select(ts => ts.Salary).ToArray();
var predictedSalaries = preductionResults.Select(r => r.Score).ToArray();

var actual = new Graph.Scatter()
{
    x = testYears,
    y = actualSalaries,
    mode = "markers",
    name = "Actual"
};

var predicted = new Graph.Scatter()
{
    x = testYears,
    y = predictedSalaries,
    mode = "line",
    name = "Predicted"
};

var chart = Chart.Plot(new[] {actual, predicted});
var layout = new Layout.Layout(){barmode = "group", title=""};
chart.WithLayout(layout);
chart.WithXTitle("Years");
chart.WithYTitle("Salary");
chart.WithLegend(true);
chart.Width = 700;
chart.Height = 400;

display(chart);
Thoughts
This was an interesting exercise to see the two languages / libraries side by side and evaluate each approach. However, this exercise was too simple to really draw any solid conclusions. I'll be looking at a multiple linear regression next to see if a more complex example can reveal more about these different implementations.
C# is my comfort zone. I felt more secure working with the language. However, in the context of Jupyter Notebooks, C# is pretty rough, and oddly enough, based on the discussion and blog posts I read while researching, it rides in on the coattails on F#. I did a little extra to help out anyone who comes after me who wants to use Binder. Here's my How To Guide for .NET with Binder
That said there are features of both implementations that I like. Python requires a lot less code to accomplish the same tasks. However the mlnet command line tool is amazing and makes it all so easy to spin up a project. We'll see where a more complicated task takes us in my next post.

Top comments (1)
FYI, Data Link is broken.