Hi everyone,
I recently made a Data Visualization about Sri Lanka COVID-19 statistics.
by the time I am writing, there was no public API to get past statistics of the COVID-19 pandemic but there was an API to get the most recent statistics. So i created one 😉.
Automate updates to database
I created a database filled out past data that was missing and created a script that updates my database with the most recent data, by that data is automatically updated without any manual tasks. for database i used MongoDB since i am very comfortable with MongoDB and also MongoDB atlas give a great free plan.
i wrote a simple JavaScript script to make a request for every 30 seconds and then if there are any latest updates update my database with those changes.pretty simple right.even though it can run locally to push changes to database , i used a aws ec2 instance to run it because it is more convenient that running it in my local PC forever.i know ec2 instance is a overkill for this purpose but this was the only option i had at the time. and if you know a better option please let me know in the comments section , like pretty please 🙄 .

Creating frontend
Frontend is build with React and styled with bootstrap , nothing fancy their. I tried out a few different data visualization libraries, but for me nivo worked out the best. it was very clear to understand and packed with tons of features.
nivo also supports responsive layouts, it looks fluid in mobile displays.it is very important to consider building responsive web apps since nowadays most of the users visit with their mobile devices. so a reasonable amount of your website's traffic will come from mobiles.
Creating API
for my API, I chose to go with AWS lambda because it is easy to spin up, and this implementation only needed one API endpoint. so I configured lambda function to fetch data and send them to frontend.
Deployment
After wiring up everything, I used zeit to deploy the frontend, because it is really easy to deploy and it supports git integrations.used MongoDB atlas for the production database, and aws lambda for API and aws ec2 to run automate script.
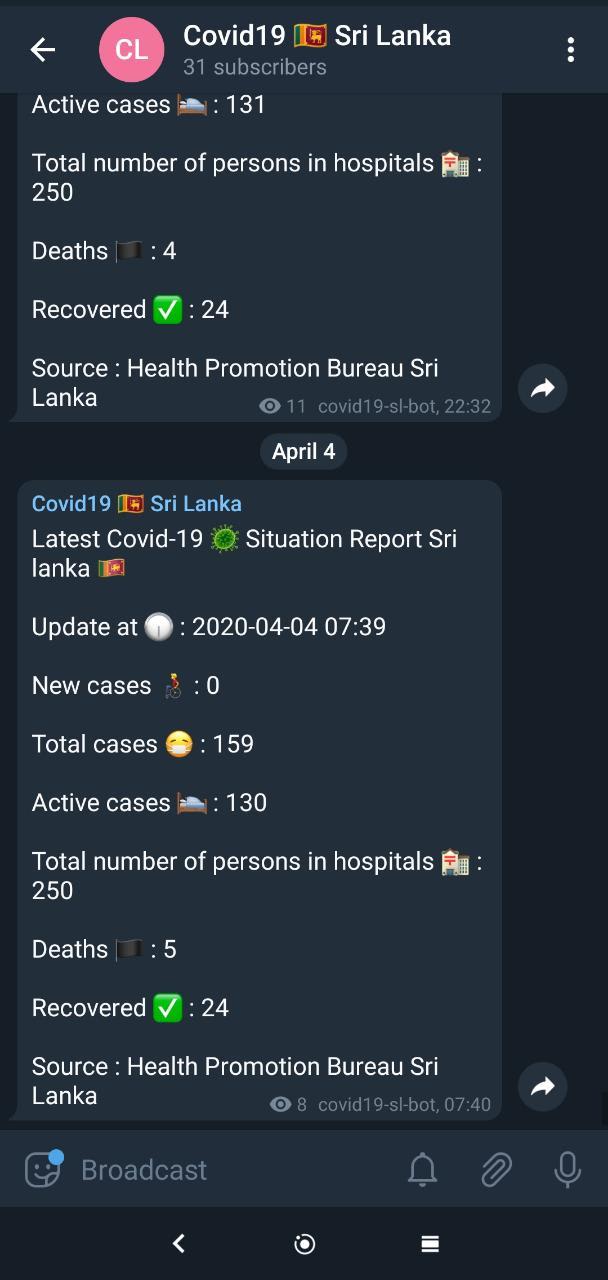
Telegram bot
As a part of this project i made a telegram channel with a telegram bot , to sent notifications about the pandemic.this was embedded to the automated script to sent a post request to telegram API in new update. more details on how to send telegram messages with bots is in this tutorial.

 RizkyRajitha
/
covidgraph
RizkyRajitha
/
covidgraph
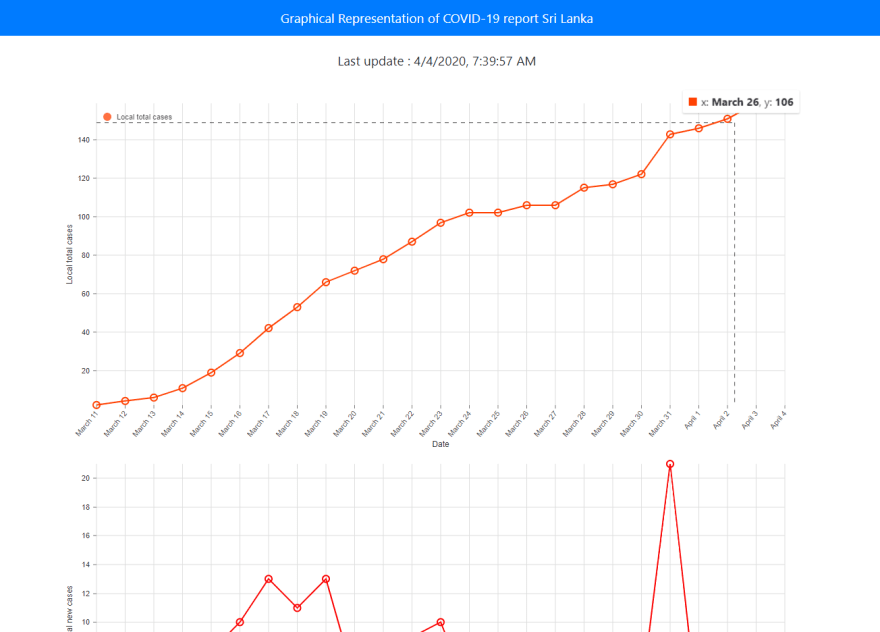
Graphical Representation of COVID-19 report Sri Lanka
Graphical Representation of covid-19 report Sri Lanka
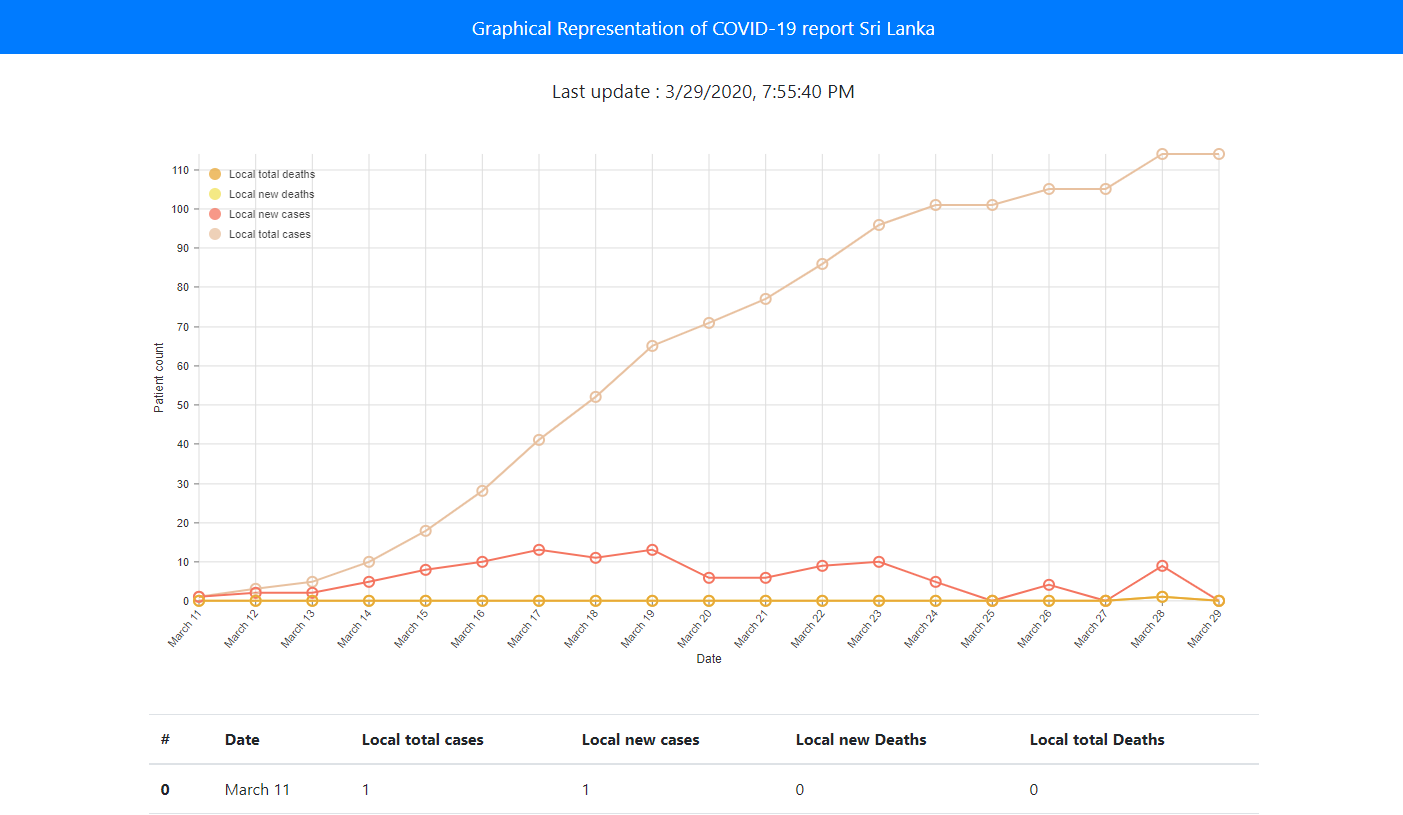
This project is a representation of data about an ongoing viral pandemic of coronavirus disease 2019 (COVID-19) in Sri Lanka.
Update 3 / 5 /2020
moved to preact for better performance . now supports PWA
![]()
added stacked view
added time range
Reference + Sources
https://hpb.health.gov.lk/en
http://www.epid.gov.lk/web/index.php?option=com_content&view=article&id=225&lang=si
https://github.com/arimacdev

Top comments (0)