Update for March 2018
The content below was created in mid to late 2017. Some of it is now out of date since we have improved our monitoring further. Big shout out to @quirogadf and @westeras for helping make the ideas come to life quickly and fixing performance issues along the way.
Overview
Hortonworks Data Platform (HDP) and Hortonworks Data Flow (HDF) are both critical components of the big data infrastructure my team supports. The big data infrastructure powers not only near real time applications but also powers analytics. Since these use cases are core to daily operations, monitoring is very important to ensure that everything runs smoothly throughout the day. There are a few components in HDP and HDF that historically have no monitoring yet are critical to ensuring proper cluster operations. We addressed the monitoring shortcomings with the Elastic stack which we were already using for other use cases. By combining HDP and HDF with the Elastic stack, we were able to build out the monitoring necessary to answer performance questions we had.
Monitoring Components
| Component Name | Description |
|---|---|
| Apache Jolokia | Exposes Java JMX metrics over HTTP endpoint. |
| Elastic - Metricbeat | Collects metrics from multiple different endpoints. |
| Elastic - Logstash | Ships metrics to Elasticsearch. |
| Elastic - Elasticsearch | Stores metrics for later analysis and alerting. |
| Grafana | Grafana allows building graphs of the metrics collected. |
Collecting Metrics
Since there were multiple HDP and HDF components that needed to be monitored, we needed a solution that would work well across the stack. We settled on exposing JMX metrics withApache Jolokia due to most of the HDP and HDF stack being Java based. This provided a single abstraction for exposing metrics and allowing the collection of metrics in a standard way. Elastic Metricbeat added beta support for Jolokia JMX collection natively in 5.4.x. We tested Metricbeat and it worked great for pulling Jolokia metrics for a variety of services. These metrics were then sent to Logstash and ingested into Elasticsearch. HDP and HDF have Grafana already installed so we were able to quickly create graphs on the data collected for each component.
We added monitoring for the following services: Ambari Metrics Collector, Ambari Server, Knox, WebHBase, and Zookeeper. We wanted to track simple JVM metrics over time like heap and garbage collection (GC). Out of the box monitoring for HDP 2.5 or HDF 3.0 does not include monitoring for the listed components. We were able to add metrics collection from these services without restarting them which was important to our use cases.
Grafana Dashboards
We configured Grafana to use Elasticsearch as a data source and then built a few custom dashboards for the metrics we were collecting. Kibana was considered for the dashboarding of metrics, but we were more familiar with Grafana and it fit within the existing HDP/HDF monitoring stack. Many of the services we built dashboards for were due to issues that we had and needed to track. Examples of these dashboards and rationale for building them is provided below.
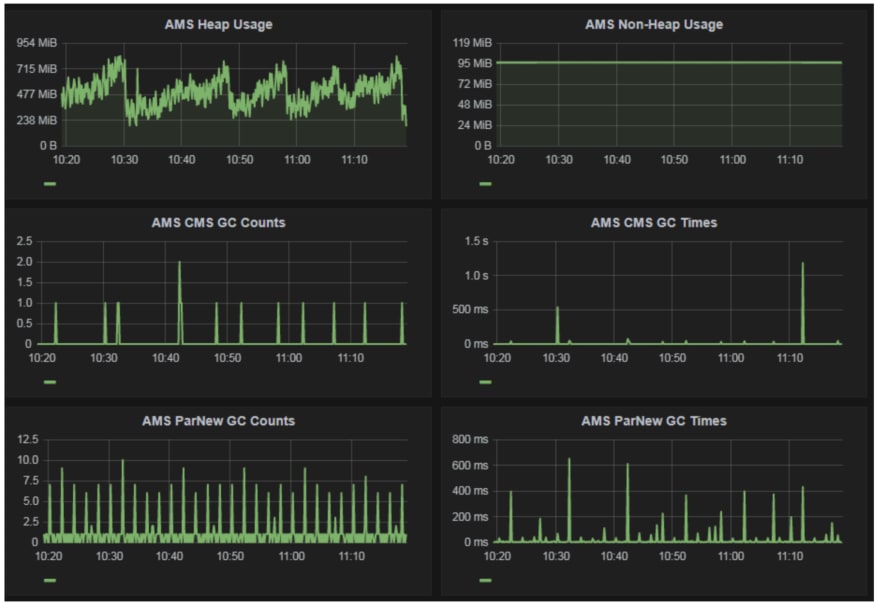
Ambari Metrics Collector
Ambari Metrics Collector somtimes automatically restarts through Ambari. We noticed that the Ambari Metrics Collector log said that the crash was due to an out of memory condition. We wanted to track heap usage over time and determine if a higher heap or different tuning should be used. We are not proactively monitoring Ambari Metrics Collector but collecting data for future use at this time.
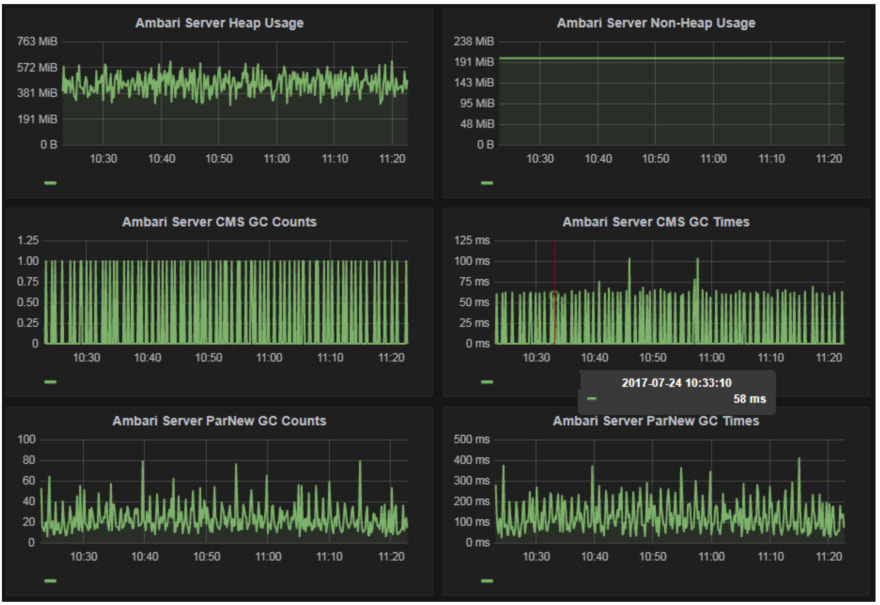
Ambari Server
Since we are evaluating Ambari Views, we wanted to track Ambari Server heap usage since the documentation says that heap should be increased for Ambari Views.
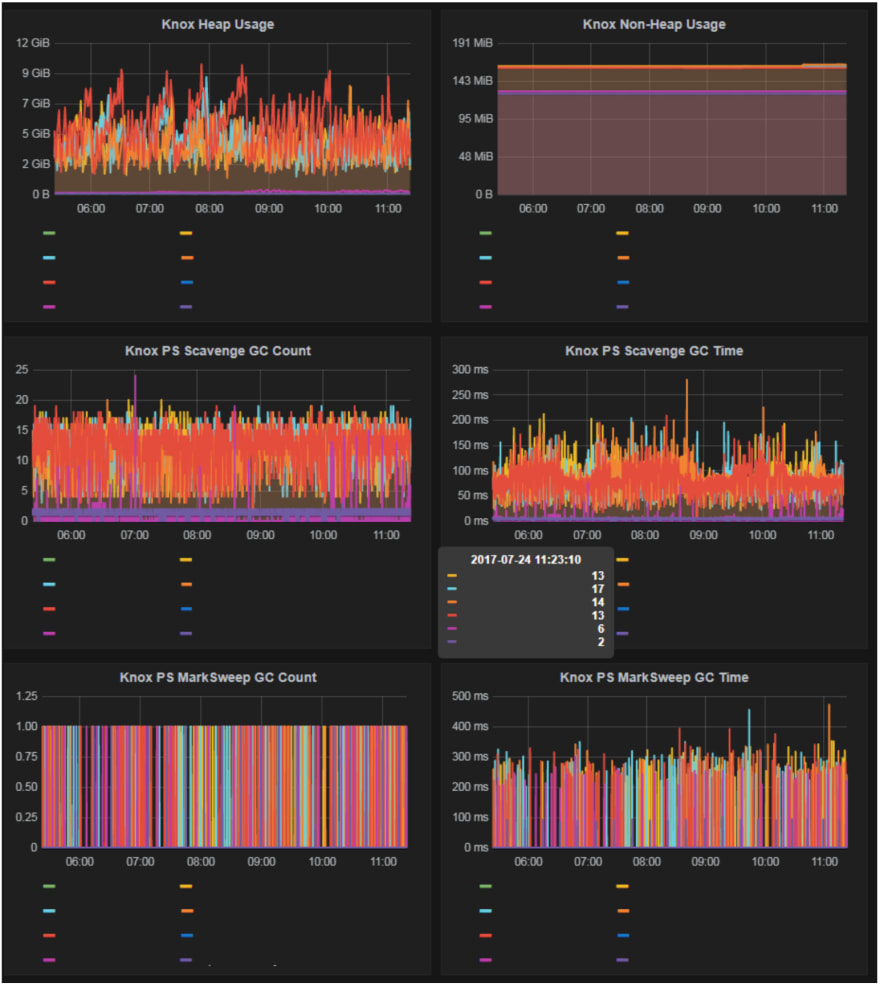
Knox
Apache Knox is important to many of our users since they access the big data environment over REST. Previously, we had no insight into performance of Knox or how much tuning could be necessary. By default, HDP does not ship with any Java GC tuning for Knox. This is troublesome since the heap is all over the place as we found out with our monitoring. After implementing Knox heap monitoring, we were able to significantly improve Knox performance due to decreased garbage collections.
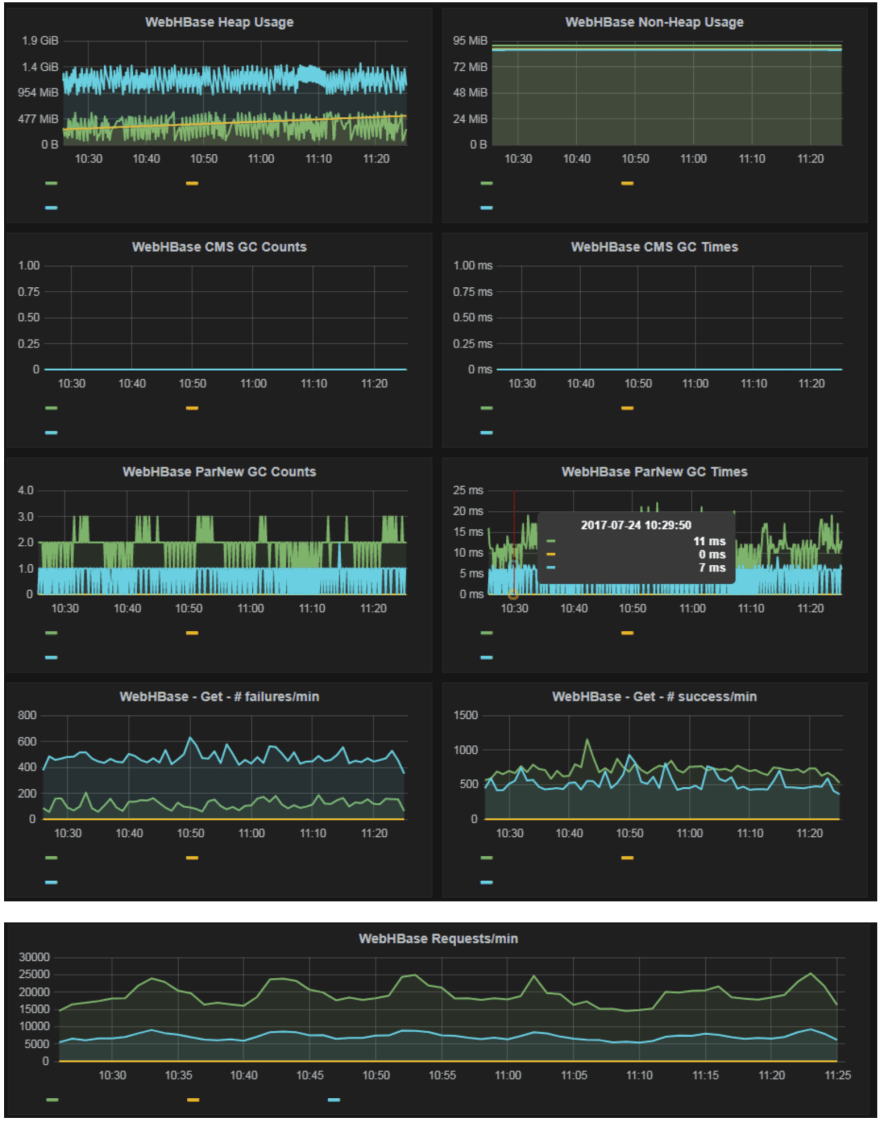
WebHBase
Many of our Apache HBase users query HBase over WebHBase through Knox. Similar to our Knox monitoring, we wanted to know how performant WebHbase was being. We track the standard Java heap usage as well as number of requests. We have used these metrics to improve WebHBase performance for our users.
Zookeeper
Apache Zookeeper is critical to high availablity capabilities for HDP and HDF. Out of the box, both HDP and HDF do not have Zookeeper monitoring. We utilize Metricbeat specific Zookeeper monitoring along with the Jolokia monitoring to provide a comprehensive view of Zookeeper performance. We are tracking Zookeeper performance specifically for HDF to ensure that we are not putting unreasonable load on Zookeeper due to HDF using Zookeeper for state management.

Setup and Configuration
Jolokia
We followed the Apache Jolokia documentation for using a Java agent to attach to a Java process. We defined a well known list of ports for the Jolokia agent to run on per service. We can either attach to a currently running JVM or to a JVM on startup.
Attaching to existing:
java -jar jolokia-jvm-1.5.0-agent.jar --host 127.0.0.1 --port <port> start <pid>
Attaching on startup:
... -javaagent:jolokia-jvm-1.5.0-agent.jar=port=<port>,host=127.0.0.1 ...
Metricbeat
With Metricbeat, we use dynamic configuration reloading to be able to change or add new metrics to be collected without restarting Metricbeat. Each yaml file is checked into version control to allow easy deployment across environments. Additionally, we use tags to group together metrics to be able to identify them in Elasticsearch later. An example of the Zookeeper yaml file is below:
- module: zookeeper
  metricsets: ["mntr"]
  enabled: true
  period: 10s
  hosts: ["ZOOKEEPER_HOST:ZOOKEEPER_PORT"]
- module: jolokia
  metricsets: ["jmx"]
  enabled: true
  period: 10s
  namespace: "jolokia_metrics"
  hosts: ["ZOOKEEPER_HOST:JOLOKIA_PORT"] path: "/jolokia/"
  jmx.mappings:
    - mbean: 'java.lang:name=PS MarkSweep,type=GarbageCollector'
      attributes:
        - attr: CollectionTime
          field: gc.psms_collection_time
        - attr: CollectionCount
          field: gc.psms_collection_count
    - mbean: 'java.lang:name=PS Scavenge,type=GarbageCollector'
      attributes:
        - attr: CollectionTime
          field: gc.pss_collection_time
        - attr: CollectionCount
          field: gc.pss_collection_count
    - mbean: 'java.lang:type=Memory'
      attributes:
        - attr: HeapMemoryUsage
          field: memory.heap_usage
        - attr: NonHeapMemoryUsage
          field: memory.non_heap_usage
Logstash
Logstash acts as a single point to interact with Elasticsearch. The beats input allows multiple Elastic beats to communicate with a single endpoint. Logstash then sends the data to the correct index in Elasticsearch.
Elasticsearch
In Elasticsearch, we used the Elastic beat templates and loaded them prior to sending in metrics. This created the proper mappings and index templates correctly for optimal performance.
Grafana
In Grafana, the Elasticsearch datasource was configured to point to our HTTP load balancer endpoint in front of Elasticsearch. We then built each graph following a similar pattern as outlined below:
Query: metricset.name:"jmx" AND metricset.host:"HOSTNAME:JOLOKIA_PORT"
Alias: HOSTNAME
Metric: Average jolokia.jolokia_metrics.gc.pss_collection_count
Group By: Date Histogram @timestamp
For a few graphs, we are calculating derivatives to show change over time instead of the cumulative average.
Conclusion and Future Work
By building a comprehensive monitoring framework, we have been able to expand from the first few services and easily add new services as necsesary. Due to this monitoring, we have been able to pinpoint performance bottlenecks and monitor our improvements. We now have insight into core components of the HDP and HDF stacks. In addition to monitoring more services, we are going to add alerts off of the collected data and tuning retention policies of the collected metric data. Furthermore, we will be building out dashboards for technical and leadership management. All of these improvements are possible without complicating the existing big data infrastructure.


Top comments (0)