In the previous part of the article, we briefly discussed the explanatory mindset that one requires to get better at reverse engineering of complex software systems. We have also tipped our toes into the nasty waters of reconstructing the meaning of the source code with the help of data state transition diagrams and pseudocode. In this second and last part of the article, I’d like to build on top of reverse engineering for the code fragments and focus on getting the software system’s blueprint. As always, I’m summarizing my personal experience, so it may or may not align with how you tackle this complex topic. Please add anything that you find relevant to this topic and particularly curious in the comments section.
Reverse Engineering for the System Blueprint
Data and Control Flow diagrams
I believe that most of us have drawn a kind of data or control flow diagram when we wanted to better understand how the software works. These diagrams are natural to draw for software systems. Since any program performs some operations on the data according to some set of conditions, the software systems can be represented as various entities that pass data to each other. In the following paragraphs, I’ll refer to these entities as operating entities.
There is no academic definition behind this term so I’d try to explain it on an intuitive level. An operating entity is something that has a well-defined function in the system or, sometimes, multiple functions. Importantly, this function (or functions) should not be shared with any other operating entity. Let’s discuss an example. You can imagine a class that handles the incoming requests for some persisted data. Upon getting a request, this class puts the request into the queue. Next, some other code within the same class polls requests from the queue to process them and persist the results. Although the polling part of the code might be implemented within the class and does not necessarily have its own encapsulation within some other class, it is the only part of the code that performs polling from the queue and decides how to process the polled request. In that sense, depending on the complexity of the logic, one could wrap this code as a Request Processor operating entity or maybe as two entities, namely, Requests Poller and Requests Dispatcher (if the processing is excluded and handled separately). Again, it does not matter if these entities are not implemented in the code. When reconstructing a data/control flow diagram, you do not invent anything new, you just collect and make the pieces of functionality visible and addressable. ‘Purification’ and naming of such operating entities is an important prerequisite for creating a comprehensive and clean data/control flow diagram.
How can you determine if you have not overlooked an operating entity? If you experience challenges in connecting operating entities that you’ve found so far, then, most likely, there is some other entity implemented in the code that you have not yet discovered. A challenge might be in the form of having entity A and entity B with entity B clearly processing data that was at some point processed by entity A but you struggle to find a concise description for the data flow arrow that connects them.
When operating entities have been discovered, list them all and briefly describe which function(s) they perform. You may also find it useful to list the data that these operating entities might be communicating through, like some shared data structures or communication channels (if the software is distributed). This will be useful when you start drawing the actual diagram.
The process of discovering operating entities in the code might remind you of refactoring, and, indeed, it is quite similar. Nevertheless, implementing operating entities that are not directly represented by the source code might not be needed due to performance reasons or due to sheer overhead of making a small piece of functionality pronounced and addressable. Anyway, while performing reverse engineering, we are not doing any actual changes to the code regardless of how appealing they may appear.
Although the academic literature advises us to split the data and control flow diagrams (DFD and CFD), personally, I prefer to combine them for reverse engineered software systems. The advantage of merging them is that it allows one to see the triggers of data flows and other operations on the data (e.g. data removal upon expiration although one may come up with something like a negative/removal data flow). To distinguish between the control flow and the data flow on the same diagram, I use different types of arrows. I use solid arrows to depict how the data moves from one operating entity in the system to another. The dashed arrows depict the control flow like triggering the events relevant for data processing. Such an arrow starts at the entity that triggers the event and ends at the recipient of the event.
Now let’s look at an example data/control flow diagram below. Although I did not yet explain everything shown there, you will find it useful to first take a look and then read the explanation. This will help you to have a reference point in your mind.

Now, let me take some time to explain what you just saw.
An additional layer of information on a data/control flow diagram is provided by the coloring. If you are colorblind, you can still use various kinds of fill (like solid, dashed, dotted, etc) in addition to the color.
I prefer to start with a separate color for the entity that initiates data processing in the system. This is likely to be some external entity, commonly, a client, or some internal asynchronous process, like a cleanup or some other scheduled task. In the diagram above, I’ve used the red color to highlight these entities (Client, Index Updater, and Expiration Service). Note that the client is external to the system so you may want to make this explicit in your diagram by changing its shape in comparison to the internal entities or draw some additional bold line between it and the rest of the system (a system boundary). In addition to the client, there are two operating entities that run asynchronous processes in the system itself. It is the Expiration Service that triggers the removal of expired versions of the data from the persistent storage and the Index Updater that reads the persisted data from time to time and updates the search index.
Other operating entities whose boxes are colored in yellow and green on the sample diagram are reactive, meaning that they do some processing only when there is the data or they are explicitly triggered. One could color all of them in the same way but I wanted to distinguish between the layer that the client directly interacts with and the deeper parts of the system. Although this is not necessary, you may find it useful to somehow emphasize (with a color or otherwise) a specific entity or a group thereof if, let’s say, they perform common functions or if you want to distinguish between the entities that are on the producing and consuming end of some queue.
Check different coloring below. The composition (boxes and arrows) is exactly the same. However, instead of emphasizing that two of the entities are in direct contact with the external client, we focus on two reactive entities (namely, In Handlers and Internal Dispatcher) participating in the production of requests for the queue and three other entities (namely, Requests Processor, Multiversion Reader, and Out Handlers) participating in the consumption of requests from the queue. This kind of coloring makes the producer-consumer pattern implemented in this system more pronounced.

As you have probably noticed (and, if not, take another look at the diagram), in addition to the operating entities, the diagram also depicts the data entities that act as a source or a destination for the data flow arrows. It turns out to be very useful for the understanding of the system to depict these data entities explicitly along with the operating entities. Most likely, the data entities will be represented as some data structures in the code (maybe from some library or even some custom classes).
There are three data entities in the diagram: the Client Requests Queue, the Search Index, and the Persistent Storage. The queue has its own style of drawing as a box containing the queued elements. I prefer to draw the queues like that to convey the semantics of this data entity graphically - it shows where different parts of the system communicate with each other.
You can also spot that I’ve used slightly different coloring across the data entities. All the data entities use the same color (blue) but two entities are filled with strokes and one has solid fill. Why is that? Well, that simply reflects the fact that the queue and the search index are in-memory structures whereas the persistent storage is… persisted (is stored on disk). This difference in fill highlights another piece of semantics that is relevant for how the system tolerates faults which might or might not be important for your reverse engineering goals. In the very same style you could distinguish between encrypted and unencrypted data entities if the security is the cross-cutting concern that you would want to emphasize in your diagrams. One could also duplicate the diagram for each cross-cutting concern and ‘recolor’ the boxes in each of them.
That was a lengthy discussion of coloring but now you can see how color and fill can be used to represent various kinds of information on the diagram. Next, let’s focus on the logic of the data/control flow.
In the example diagram, it is pretty intuitive to deduce the sequence in which the data passes through the operating entities. The data flow starts at the client (remember that the client is the originator of a request, or a proactive operating entity) and proceeds through the system. At some point the data lands into the queue which it later leaves to be processed by the request processor. The request processor needs additional pieces of data to process the request: a specific location on the disk (let’s call it a bucket) to fetch the data from and the profile info fetched from the disk. Here things become slightly ambiguous although still understandable. Does the request processor get the bucket first and then the profile info? Or both at the same time? The first assumption is the correct one. The request processor needs to first learn which bucket of the persistent storage to query, then it can query data from the storage.
When you reverse engineer a software system, you will likely encounter cases when the correct sequence is not all that evident. For these cases, I number the arrows with small encircled numbers that highlight the sequence in which the data flows in the system and in which the events are triggered. Sometimes, one would need to show simultaneous or unordered data flows, e.g. if the component extracts the data from multiple sources and combines it in the scope of one meaningful logical step. Then, one can use the same number on multiple arrows. In the below diagram, I do this with ‘3’ that labels both an arrow that puts the profile info request into the queue and another arrow that notifies the request processor about the possibility of polling from the queue. Such numbered and chained representation on the diagram might come in quite handy when you need to reflect the data/control flow in a system full of asynchronous calls and callbacks. Such systems require a considerable amount of mental effort to understand so we’ll not cover them in this article in depth.
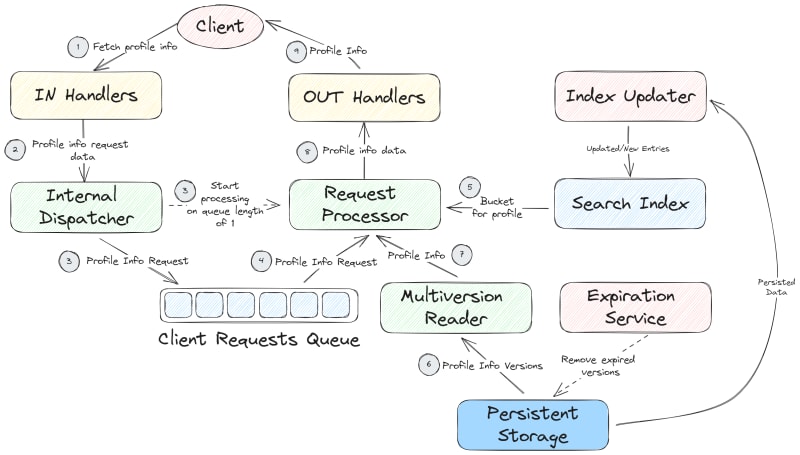
Notice that we’ve numbered not all of the arrows. Indeed, how would you number an arrow that originates at some operating entity that is internal to the system? Or maybe another arrow originating at the client that represents a write operation? Should it precede the read operation (“fetch profile info”) or not? These are all valid questions but they have nothing to do with how we represent the flow of data or control on the diagram. These questions arise since the above diagram does not do its job well. This diagram shows multiple distinct data/control flows at once! The one that we have numbered is a read flow (more specifically, fetch profile info flow, because there might be more read flows). However, there are two more. Both originate from the asynchronous operating entities - the expiration service and the index updater. Depending on your goals, you may leave them in the same diagram or you may want to drag them into a separate one since they meet only at the data entities, so, they do depend on the same data, but they do so in different ways.
To address the issue of intersecting data/control flows, I prefer to draw multiple data/control flow diagrams - one for each such flow. Otherwise, the diagrams tend to get cluttered and thus hard to navigate and reason about. So, below is how I’d dissolve the previous diagram into three: profile info read flow, index update flow, and the data expiration flow. As you can see, some operating entities are repeated across these diagrams; however, it becomes easy to argue about each flow separately. The disadvantage of introducing a separate diagram per each flow is that it becomes slightly more difficult to find the dependencies between different flows, and, as practice shows, most of the obscure design issues and bugs lurk in the intersection of multiple flows (usually, operating on the shared data). Hence, one may want to preserve the bigger diagram along with sub-diagrams for every flow to clearly see where the flows intersect e.g. by relying on some shared data like the search index or the persistent storage.

Space-time diagrams (aka Lamport diagrams)
Let’s admit it, engineering distributed systems is far from easy. Therefore, a good diagram is worth a thousand words in that domain. If your software system falls into the category of distributed then you need to reflect this aspect on your diagrams. When dealing with the distributed aspects, we depart from the functionality-first view of this article. The reason is that some characteristics of your system contributing to its ultimate value proposition, like reliability, rely on the distributed design of your system.
The key aspect of a distributed system that needs to be properly understood and visualized is replication. In a nutshell, replicated data is the same data repeated on several distinct pieces of virtual or physical infrastructure, so, kind of like having multiple copies of the same data spread across several servers.
Why do we replicate the data? There are a couple of reasons. First, to increase fault-tolerance. Second, to achieve higher performance. We ignore the second aspect and focus on the first one.
What makes replication hard? Ideally, one wants to modify the data and have every copy of this data to be exactly the same at every point in time, that is, one wants all the replicas to be consistent with each other. At the same time, people are somewhat reluctant to have a single point of failure e.g. a server that all the operations pass through. On the side of limitations, there is the ‘hardcoded’ limit on the speed of light and various kinds of communication failures that just happen. As a result, a modification applied to one of the replicas (copies) might get lost or delayed for another replica. Therefore, engineers have to figure out the best mixture of design goals that satisfies the use cases valid for the designed system. Then, these requirements and limitations are manifested as a replication algorithm in the code of your system. It might be external (in some library) or it might be custom-built. Still, if you offer a stateful distributed system, you have to deal with the task of replication and ensuring some sort of consistency.
So, how to best describe the replication algorithm implemented in the system that you reverse-engineer?
For the purpose of fault-tolerance, it is helpful to describe how the replication is handled in various operational scenarios. It is usually easier to start with a happy path where no crashes and network partitions occur, and the system operates as intended. Then, one proceeds to specify how the replication algorithm handles common failures e.g. an instance going down or a communication being temporarily interrupted. Let’s begin with the normal operation scenario.
There is a certain kind of diagram that helps to represent distributed algorithms in a clear and concise form. Given their inherent complexity, these are definitely desirable properties for a diagram. Such diagrams are called space-time diagrams or Lamport diagrams (named after the Turing laureate Leslie Lamport). These diagrams may remind you of sequence diagrams but they introduce the notion of requests (calls) delay and the possibility of entity crash.
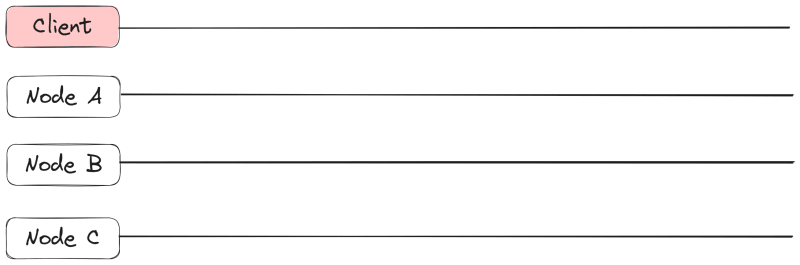
Lamport diagram focuses only on the system instances that maintain the replica of the same data entity. So, even if your system is deployed on hundreds of servers, it is not necessary to bring all of them into the diagram, you just need to focus on as many as your replication factor (the total number of replicas maintained for each data entity) is set to be. This number is rather small for trusted environments. In addition to the servers each maintaining a replica of a data item, you will need to depict a client that serves as an origin of the requests and the destination of the responses for your system. Sometimes, requests may be purely internal, then one of the instances of your system acts as a client.
Each server (also called node) and the client will get its own horizontal line with its name to the left of the line. This line represents the ‘lifetime’ of the server or a client, it is like a local time axis of the entity (client or a node). The flow of time in this diagram is from left to right. If your system relies on shared storage, like AWS S3, then it should also appear on such a diagram. For the sake of keeping the discussion short, we’ll focus on the shared-nothing distributed system design, i.e. when no two servers have common storage. Below is the example of nodes and a client depicted on such a diagram.
Let’s assume that the system that we reverse-engineer implements one of the most common replication approaches - primary-backup replication. In this kind of replication, each node that keeps the replicated data item assumes one of the following roles: a coordinator or a follower. They might also be called differently, e.g. a master and a follower, a primary and a backup.
Coordinator role requires the node to order the updates to the replicated data that is present on the coordinator and on the followers. Intuitively, it should be clear that only one such node should be present for the replicated data entity to avoid conflicting updates to the replicated data. The coordinator role can be transferred to another node if the original coordinator fails or becomes unresponsive. The nodes with the follower role can only perform writes that are issued by the coordinator node.
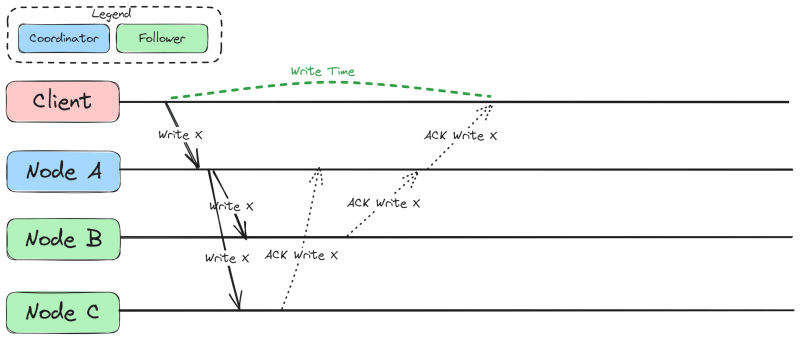
Depending on the specific replication behavior that you want to depict, you may color the label of the node to reflect its role or you may draw an appropriately colored box around the local time axis of the entity. The former is helpful to avoid clutter when analyzing common scenarios whereas the latter is helpful when you want to accurately represent replication behavior in the presence of changing roles of the nodes (useful for debugging). Both options are represented below. We will focus on the first one.


Probably, the easiest way to find the code implementing the replication is by searching for requests that the nodes exchange to replicate the data or to track how the new data propagates in the system. You could deduce whether the code belongs to the master (coordinator) or follower (backup) role depending on whether it is triggered by the request that originates from the client or from another node of the system (master). Figuring out the distribution of roles in replication algorithms might be the most challenging problem but it is still soluble. Since there are a handful of replication algorithms commonly used in the software systems, after getting acquainted with them you will have an easier time matching the code to the algorithm that it implements.
Once you’ve figured out the roles of the nodes, say master and follower, you need to track the requests that they send to each other as well as the conditions of sending and accepting these requests. Ideally, you would try to find the original request from the client that hits the master and depict it on the diagram with an arrow. Then, it should be possible to track all the subsequent requests and responses of other nodes. Be mindful of ordering for these requests because the guarantees and the performance that you can deduce from the diagram will depend on how you depicted this communication.
In our example, primary-backup replication starts with the client sending a request to the coordinator node, that is, node A. Then, once node A is done processing the request and persisting its results, this node may not reply to the client straight away but instead will send the result of this request to both nodes B and C. Node A will also wait for the acknowledgements from these nodes prior to confirming to the client that the data has been successfully modified In the diagram below, the acknowledgements are shown with the dotted arrows and labels ACK Write X whereas the actual writes are shown with solid arrows labeled with Write X. As you can see, the whole write issued by the client can take quite a while because the acknowledgement from node B was delayed (notice the write time depicted with the dashed green line). It is not necessary to depict the delays like that - you may want the diagram to be more general. However, be wary that delays can rearrange the order of many requests and responses.
Now, let’s change this diagram slightly:

Can you see what changed in this diagram compared to the previous one? In this new diagram, the ACK Write X arrow from Node A to the client directly follows the Write X arrow from the client on the time axis of node A, that is Node A does not wait for acknowledgements from nodes B and C. In practice, this would mean that the guarantee on the write that the client performed is different compared to the previous diagram. With the algorithm reflected in the new diagram, when the client gets an acknowledgment of its write, it means that the data is only on Node A whereas in the previous diagram it meant that the data was present on all the nodes: A, B, and C. Is it bad? In terms of fault tolerance - yes. However, if we consider the latency of client operations, the second option depicted in the new diagram is actually faster. Compare the length of the segment of Node A’s timeline labeled as write time to the segment with the same label in the previous diagram. The write time segment in the new diagram is considerably shorter than in the previous one. If your system needs to perform thousands or tens of thousands of such writes per second, then this option with waiting only for one acknowledgement may become very appealing since the client gets their response quickly. On the other hand, the cost of latency reduction might be inappropriate for your software if the use case requires guaranteeing some level of fault tolerance when one of the nodes crashes after client got acknowledgement of the write operation. With that in mind, let’s dive into representing the failure scenarios with Lamport diagrams.
You could imagine the following failure scenario that the Lamport diagram can represent fairly well: Node A acknowledged the write to the client but then immediately crashed without completing the replication to other followers. This might be a plausible scenario for the system that you attempt to reverse-engineer and it thus becomes very important to catch such a case and depict it. With such diagrams, you will learn a lot about the ways in which you may be losing the data and whether it aligns with the guarantees that you provide to the users of your system. In the below diagram, the crash of Node A is represented with the crossed circle of red color, also the timeline for this node ends abruptly at this circle. Node B becomes coordinator for X which is depicted with its repeated label colored with blue color. Notice that a subsequent read of X from client to node B returns nothing because node A failed before replicating the data to nodes B and C. The same could have happened if it succeeded in replicating X to node C but not to node B.

In addition, the same situation may occur even if Node A does not crash but the client is allowed to read from the followers. Below, you can see an example where the write to node B was not fast enough and thus the client could not read the value of X that it wrote previously since it chose Node B for its read (maybe due to some load balancing mechanisms). For the sake of convenience, the part of nodes timelines shown in red represents the fact that the value of X has not yet been written to them. With that, it becomes obvious why Node C that the client attempts to read from returns that it does not know X.

Such mishaps occur because from the point of view of the client, all three nodes act as a single virtual entity, also called a replication group. Such an interface allows to hide the concern of fault tolerance from the client but, as you can see, depending on how fault tolerance is implemented, the client may get different guarantees on what to expect from the system.
The topic of distributed systems and guarantees is very vast. We’ve just scratched the surface in this article. The intention was to show you how certain kinds of diagrams can help you reverse engineer the distributed algorithms that your software implements. The challenge here is that you have to take into account both the code that embodies the happy path as well as the possible edge cases with various kinds of failures occurring in your system. Thus, it usually makes sense to create the happy path diagram first and then start introducing various kinds of failures and see how the diagram would change in response to them. From these diagrams you will also get another piece of information about your software system that will become very important on the next stage of reverse engineering. In essence, you will get the guarantees that the system provides to the use cases in respect to the data stored in it and the information on which properties of the system are prioritized (possibly, at the cost of others).
Written concise statements about the system
All the previous tools were instrumental to this pinnacle of reverse engineering. We started at the code level and then gradually went up peeling off everything that does not directly relate to the logic of the system. We’ve been reducing the level of detail while increasing the scope in each new diagram and description. At the very end of the reverse engineering exercise, an engineer should be able to describe the reverse-engineered system in a set of concise statements. These written statements might be quite diverse.
Among the most important categories I could list the following:
- guarantees to the application/use case of the system, like “System Foo supports strong consistency for the client data” or “System Foo stores the client data in an encrypted format”;
- key system architecture choices, like “System Foo implements distributed system architecture based on shared storage” and “System Foo replicates client data using chain replication approach”;
- interfaces available to the use cases/applications like “A client of the System Foo can connect, perform reads and writes of its own state”;
- summary of the key functionality, like “System Foo dispatches the client requests to the internal queues by using the client ID and the key of the request to look up the destination queue ID in the Queue Index”.
These concise statements will serve you and your team as a reminder of how the system works at the highest level and what it offers its users. Concise statements also help to bring one’s attention to the relevant pieces of logic and behaviors of the system. Note that using these statements in the discussions requires that the participants would have a similar level of understanding of what hides behind each of these statements. It is also of great value to understand what each of these statements means for the design of the system in terms of opportunities and limitations as well as for the services that the system is able to perform for its users. In other words, the participants of the architectural discussion need to have the same context. Otherwise, there is a real danger that the discussion turns out to be too superficial or abstract for those that lack this context.
Let’s have a closer look at the example statement “System Foo implements distributed system architecture based on shared storage”. Having read this statement, an engineer will recall both the fundamental advantages as well as the disadvantages of this design choice. He or she will also quickly discover which implications this choice will have for the availability of the system and replication speed on cluster composition changes. Such statements are a very powerful tool to shape the discussions around certain key aspects of the system design in the team and thus should be carefully crafted based on the evidence collected on the previous steps. Ideally, you would want to refine and agree on these statements as a team since they will likely stick with you for a while and thus they need to be very precise; in addition, some of these statements may be converted to marketable value propositions for the product of the company if it sells software or offers SaaS solutions.
Instead of Conclusion: Key Takeaways
I will not repeat myself on the use of specific diagrams and representations for performing the task of reverse engineering. Instead, I’d like to reiterate on the overall approach to the task of reverse engineering.
First and foremost, you need to cultivate the explanatory mindset in yourself to succeed in reverse engineering. You can acquire it by trying to simplify your explanations of how the software works and by gradually reducing the amount of details in your explanations and using more and more general terms. Reverse engineering is a bottom-up approach but you may also find it useful to compare the results of your reverse engineering exercise with the documentation that is already available for the software system (if you are lucky enough to have it). Given that we live in the age of abundance of versatile software systems that gradually get rooted into various business processes of companies, it would be one of the most sought after skills in software engineering.
Another important point is that you need to think outside-of-box when trying to unveil the design blueprint of the software system. Try different diagrams and representations, do not limit yourself by whatever you have seen in this article or in other sources (like UML diagrams and whatever is taught at the university). Being creative and at the same time focused will help you a lot to get a clear picture of the software that you are working on and would bring you far in improving and expanding it.
Reverse engineering is a kind of destination but at the same time it is also a journey. While wrestling with unfamiliar code and trying to figure out better and more concise representations, you would also alter numerous connections in your brain and start thinking differently about the software system that you work on. This is a necessary part of professional growth that you will likely miss if you only work on hobby or greenfield projects. What will help you on this path is binding the reverse engineering exercise to reading various theoretical books that expose you to software design patterns, data structures, and so on. However, those should not be read in isolation from the reverse engineering activity. Just by reading them you won’t learn much, maybe you will even make yourself worse off because of time spent on reading and getting detached from the code and the practice of programming. One should strive to avoid this at any cost.
A Note on Other Approaches
Written concise statements are good but what about ADRs?
I’ve used ADRs for documenting. Personally, I’ve found them practical to initiate the discussions about specific design issues (RFC-style) and to document fresh design decisions (i.e. that have not yet been taken in the past). I did try to use them to document the past design decisions as well but performing the archeological task this way turns out pretty sour very quickly.
In my experience, ADRs are VERY verbose for documenting the past design choices and are not very useful since one would have to read through all of these ADRs in order to restore the full state of the system design. This is very time-consuming. In addition, they are quite linear and do not let one easily highlight some cross-cutting design concerns without repetition in multiple ADRs. Last but not least, in an ideal world, you’d need to interview the stakeholders who took the design decision in the past. Otherwise you’ll end up documenting your phantasies which may be reasonable, but they are still, well, phantasies.
In contrast, the approach taken in this article focuses on creating a snapshot of the state of your software system’s design and on making it as independent of minute details as possible.
Aren’t you reinventing UML diagrams here?
First of all, my goal is not to invent THE diagrams (as compared to THE standards which one just cannot get enough of) but rather to show how to produce these artifacts based on the code at hand and how to proceed from one diagram (or, more general, a representation) to another on higher level in a somewhat meaningful way. Indeed, the diagrams in this article will resemble some of the UML diagrams or other diagrams. In the end, they revolve around the same concepts and same relations. You may use UML diagrams if you like them (I, personally, don’t, and I did try them on multiple occasions). This is a perfectly valid tool for the task of reverse engineering as well, might be a bit more strict and verbose, but still valid.

Top comments (1)
Amazing!