
TLDR: I wrote a tool to get real time problem report across bulk Kubernetes clusters, check it out at https://github.com/ReallyLiri/kubescout

Motivation
Clusters can be monitored and investigated using a variety of tools. Yet, most of them focus too much on the user’s defining their success metrics and are too generic in their approach.
What I wanted was a simple tool that would tell me what was wrong and where. Ideally, it should be in real time and across all the clusters I manage.
How to Run It
It can be run as a command line tool and in more advanced scenarios as a Docker image or Kubernetes job.
While the command line has a lot of options, the most important ones are probably what contexts and namespaces to scout. The tool was designed with multi-contexts in mind, so you can run it against bulk clusters, not just bulk namespaces.
Here are a few simple examples of runs:
kubescout --kubeconfig /root/.kube/config --name staging-cluster
kubescout --exclude-ns kube-system
kubescout --include-ns default,test,prod
kubescout -n default -c aws-cluster
Full CLI usage:
NAME:
   kubescout - 0.1.15 - Scout for alarming issues in your Kubernetes cluster

USAGE:
   kubescout                    [optional flags]

OPTIONS:
   --verbose, --vv                        Verbose logging (default: false) [$VERBOSE]
   --logs-tail value                      Specifies the logs tail length when reporting logs from a problematic pod, use 0 to disable log extraction (default: 250) [$LOGS_TAIL]
   --events-limit value                   Maximum number of namespace events to fetch (default: 150) [$EVENTS_LIMIT]
   --kubeconfig value, -k value           kubeconfig file path, defaults to env var KUBECONFIG or ~/.kube/config, can be omitted when running in cluster [$KUBECONFIG]
   --time-format value, -f value          timestamp print format (default: "02 Jan 06 15:04 MST") [$TIME_FORMAT]
   --locale value, -l value               timestamp print localization (default: "UTC") [$LOCALE]
   --pod-creation-grace-sec value         grace period in seconds since pod creation before checking its statuses (default: 5) [$POD_CREATION_GRACE_SEC]
   --pod-starting-grace-sec value         grace period in seconds since pod creation before alarming on non running states (default: 600) [$POD_STARTING_GRACE_SEC]
   --pod-termination-grace-sec value      grace period in seconds since pod termination (default: 60) [$POD_TERMINATION_GRACE_SEC]
   --pod-restart-grace-count value        grace count for pod restarts (default: 3) [$POD_RESTART_GRACE_COUNT]
   --node-resource-usage-threshold value  node resources usage threshold (default: 0.85)
   --exclude-ns value, -e value           namespaces to skip [$EXCLUDE_NS]
   --include-ns value, -n value           namespaces to include (will skip any not listed if this option is used) [$INCLUDE_NS]
   --dedup-minutes value, -d value        time in minutes to silence duplicate or already observed alerts, or 0 to disable deduplication (default: 60) [$DEDUP_MINUTES]
   --store-filepath value, -s value       path to store file where state will be persisted or empty string to disable persistency (default: "kube-scout.store.json") [$STORE_FILEPATH]
   --output value, -o value               output mode, one of pretty/json/yaml/discard (default: "pretty") [$OUTPUT_MODE]
   --context value, -c value              context name to use from kubeconfig, defaults to current context
   --not-in-cluster                       hint to scan out of cluster even if technically kubescout is running in a pod (default: false) [$NOT_IN_CLUSTER]
   --all-contexts, -a                     iterate all kubeconfig contexts, 'context' flag will be ignored if this flag is set (default: false)
   --exclude-contexts value               a comma separated list of kubeconfig context names to skip, only relevant if 'all-contexts' flag is set
   --help, -h                             show help (default: false)
   --version, -v                          print the version (default: false)
Output
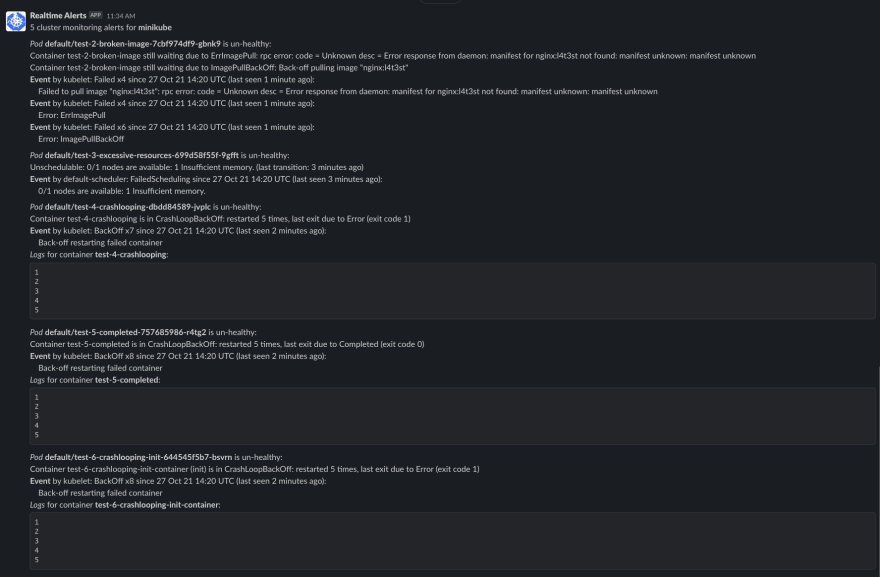
The alerts themselves would be the most interesting output. By default, the tool will simply print them to the console. By wrapping the go code, you can define your own output sink and forward the alerts to any aggregation service or alerting service. Additional built-in sinks may be added in the future.
An example of alerts forwarded to Slack:
The Complicated Stuff
Kubernetes’ API is very easy to use. It’s user friendly and well documented. However, understanding the models it returns is quite challenging. When kubectl receives raw data from the API, it performs a lot of view transformations. A “Terminating” pod, for example, is actually detected using a “DeletionTimestamp” attribute, while this state is not reflected in its phase or status.
In order to find the faulty states and determine what they mean, some reverse engineering had to be done.
Noise reduction was one of the most sought-after features. It is not possible to reliably de-duplicate alerts using a standard alert aggregation system. The state is too complex — it contains timestamps, counters, random names, etc., requiring inside knowledge of the models in order to actually de-duplicate.
As a result, a state maintained by the tool is used to determine whether an alert is new or not. As a consequence, when you run it repeatedly, it will maintain state and remember what has already been acknowledged. You can then define redundancy on the alerts, since at some point you probably want to be alerted again about the problem.
On-Premise
On-premise clusters, which aren’t managed by cloud providers, were another motivation for developing this tool. Without an admin to help maintain the cluster on the other end, I faced many issues managing these on-premise clusters. I needed a tool that could diagnose problems on all levels, including native errors, and possibly also fix them.
It was my intent to add alerts for node resources (disk, memory, CPU), kubelet errors, and much more. However, I am no longer working on monitoring on-premise clusters, so these features are on hold at the moment.
Contribution
We would appreciate any contribution you can make. There is probably a lot more ground to cover, especially for cases that I didn’t encounter.
Remediation is also on the roadmap, which I believe is the natural next step for this tool.

Top comments (1)
Nice article! Thanks.