Originally published on: realdataweb.wordpress.com
In real estate, spatial data is the name of the game. Countless programs in other domains utilize the power of this data, which is becoming more prevalent by the day.
In this post I will go over a few simple, but powerful tools to get you started using using geographic information in R.
##First, some libraries##
#install.packages('GISTools', dependencies = T)
library(GISTools)
GISTools provides an easy-to-use method for creating shading schemes and choropleth maps. Some of you may have heard of the sp package, which adds numerous spatial classes to the mix. There are also functions for analysis and making things look nice.
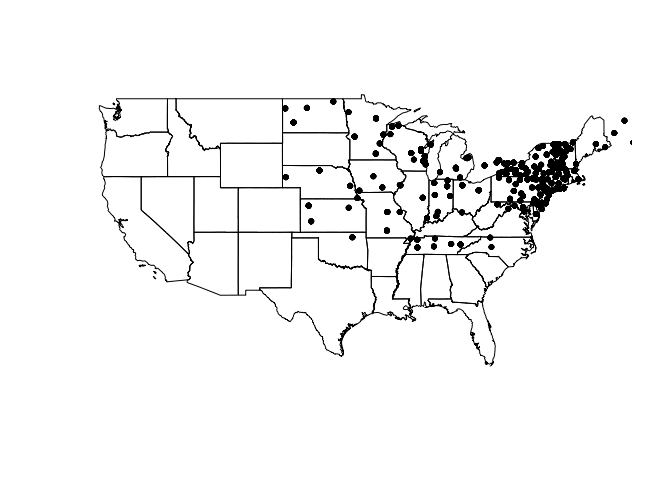
Let's get rolling: source the vulgaris dataset, which contains location information for Syringa Vulgaris (the Lilac) observation stations and US states. This code plots the states and vulgaris points.
data("vulgaris")          #load data
par = (mar = c(2,0,0,0))  #set margins of plot area
plot(us_states)
plot(vulgaris, add = T, pch = 20)
One thing to note here is the structure of these objects. us_states is a SpatialPolygonsDataFrame, which stores information for plotting shapes (like a shapefile) within its attributes. vulgaris by contrast is a SpatialPointsDataFrame, which contains data for plotting individual points. Much like a data.frame and $, these objects harbor information that can be accessed via @.
kable(head(vulgaris@data))
| Station | Year | Type | Leaf | Bloom | Station.Name | State.Prov | Lat | Long | Elev | |
|---|---|---|---|---|---|---|---|---|---|---|
| 3695 | 61689 | 1965 | Vulgaris | 114 | 136 | COVENTRY | CT | 41.8 | -72.35 | 146 |
| 3696 | 61689 | 1966 | Vulgaris | 122 | 146 | COVENTRY | CT | 41.8 | -72.35 | 146 |
| 3697 | 61689 | 1967 | Vulgaris | 104 | 156 | COVENTRY | CT | 41.8 | -72.35 | 146 |
| 3698 | 61689 | 1968 | Vulgaris | 97 | 134 | COVENTRY | CT | 41.8 | -72.35 | 146 |
| 3699 | 61689 | 1969 | Vulgaris | 114 | 138 | COVENTRY | CT | 41.8 | -72.35 | 146 |
| 3700 | 61689 | 1970 | Vulgaris | 111 | 135 | COVENTRY | CT | 41.8 | -72.35 | 146 |
Let's take a look at some functions that use this data.
newVulgaris <- gIntersection(us_states, vulgaris, byid = T)
kable(head(data.frame(newVulgaris)))
| x | y | |
|---|---|---|
| 3 4896 | -67.65 | 44.65 |
| 3 4897 | -67.65 | 44.65 |
| 3 4898 | -67.65 | 44.65 |
| 3 4899 | -67.65 | 44.65 |
| 3 4900 | -67.65 | 44.65 |
| 3 4901 | -67.65 | 44.65 |
gIntersection, as you may have guessed from the name, returns the intersection of two spatial objects. In this case, we are given the points from vulgaris that are within us_states. However, the rest of the vulgaris data has been stripped from the resulting object. We've got to jump through a couple of hoops to get that information back.
newVulgaris <- data.frame(newVulgaris)
tmp <- rownames(newVulgaris)
tmp <- strsplit(tmp, " ")
tmp <- (sapply(tmp, "[[", 2))
tmp <- as.numeric(tmp)
vdf <- data.frame(vulgaris)
newVulgaris <- subset(vdf, row.names(vdf) %in% tmp)
| Station | Year | Type | Leaf | Bloom | Station.Name | State.Prov | Lat | Long | Elev | Long.1 | Lat.1 | optional | |
|---|---|---|---|---|---|---|---|---|---|---|---|---|---|
| 3695 | 61689 | 1965 | Vulgaris | 114 | 136 | COVENTRY | CT | 41.8 | -72.35 | 146 | -72.35 | 41.8 | TRUE |
| 3696 | 61689 | 1966 | Vulgaris | 122 | 146 | COVENTRY | CT | 41.8 | -72.35 | 146 | -72.35 | 41.8 | TRUE |
| 3697 | 61689 | 1967 | Vulgaris | 104 | 156 | COVENTRY | CT | 41.8 | -72.35 | 146 | -72.35 | 41.8 | TRUE |
| 3698 | 61689 | 1968 | Vulgaris | 97 | 134 | COVENTRY | CT | 41.8 | -72.35 | 146 | -72.35 | 41.8 | TRUE |
| 3699 | 61689 | 1969 | Vulgaris | 114 | 138 | COVENTRY | CT | 41.8 | -72.35 | 146 | -72.35 | 41.8 | TRUE |
| 3700 | 61689 | 1970 | Vulgaris | 111 | 135 | COVENTRY | CT | 41.8 | -72.35 | 146 | -72.35 | 41.8 | TRUE |
Look familiar? Now we've got a data frame with the clipped vulgaris values and original data preserved.
vulgarisSpatial <- SpatialPointsDataFrame(data.frame(newVulgaris$Long, newVulgaris$Lat), newVulgaris, proj4string = CRS(proj4string(vulgaris)), bbox = vulgaris@bbox)
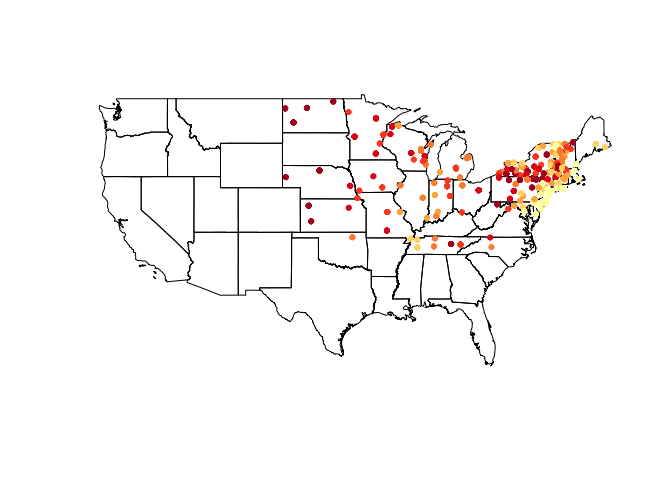
After storing our clipped data frame as a SpatialPointsDataFrame, we can again make use of it - in this case we add a shading scheme to the vulgaris points.
shades <- auto.shading(vulgarisSpatial@data$Elev, n = 7, cols = brewer.pal(7, 'YlOrRd'))  #Check cutter arg for more ways to create breaks.
shades$cols <- add.alpha(shades$cols, .5)
plot(us_states)
choropleth(vulgarisSpatial, vulgarisSpatial$Elev,shading = shades, add = T, pch = 20)
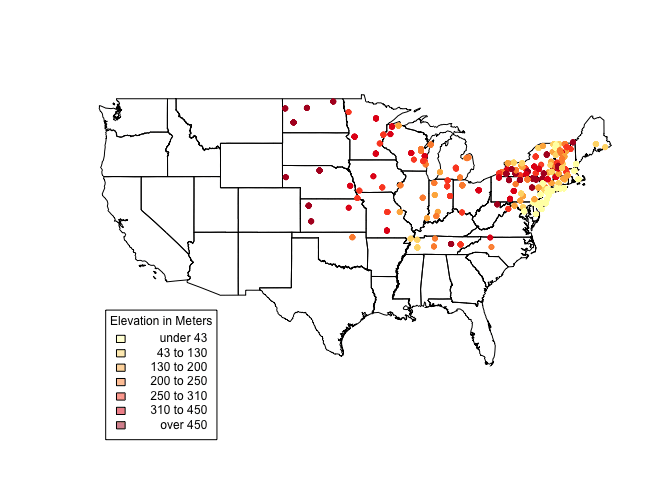
Colors are pretty, but what do they mean? Let's add a legend.
us_states@bbox #Get us_states bounding box coordinates.
##           min       max
## r1 -124.73142 -66.96985
## r2   24.95597  49.37173
plot(us_states)
choropleth(vulgarisSpatial, vulgarisSpatial$Elev,shading = shades, add = T, pch = 20)
par(xpd=TRUE)           #Allow plotting outside of plot area.
choro.legend(-124, 30, shades, cex = .75, title = "Elevation in Meters") # Plot legend in bottom left.  Takes standard legend() params.
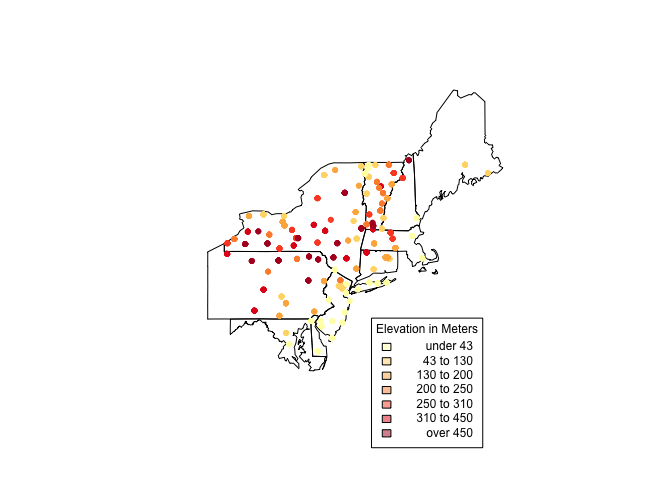
It looks like there's a lot going on in the Northeastern states. For a closer look, create another clipping (like above) and plot it. Using the structure below, we can create a selection vector. I have hidden the full code since it is repetitive (check GitHub for the full code.)
index <- us_states$STATE_NAME == "Pennsylvania"
         '...'
plot(us_states[index,])
choropleth(vulgarisNE, vulgarisNE$Elev,shading = shades, add = T, pch = 20)
par(xpd = T)
choro.legend(-73, 39.75, shades, cex = .75, title = "Elevation in Meters")
Hopefully this has been a useful introduction (or refresher) on spatial data. I always learn a lot in the process of writing these posts. If you have any ideas or suggestions please leave a comment or feel free to contact me!
Happy mapping,
Kiefer


Top comments (1)
This is awesome! Really makes me want to learn R now