This article helps you to understand what to monitor if you have or are bringing a new service to run in production.
Motivation
Monitoring gives us the ability to understand our system’s health, address performance and availability issues based on data. I would like to mention a couple of reasons why you need monitoring right now:
- Without monitoring software ownership is not possible.
- You can’t say how much of availability your service had in the event of an outage.
- You have no clue if your service is getting slower over time and why it does so. Was memory high or was a dependency which affected your service? Or was a dependency of your service dependency?
- It might takes months or even years to investigate why a portion of your customers were getting logged out of your website, why they couldn’t list their account preferences during the night and so on.
- During outages, engineers need to use data to take decisions, otherwise they will always have to depend exclusively from the opinion and feelings of the most senior engineer around.
- The lack of monitoring is a massive anti-pattern for infrastructure engineering teams.
What to Monitor?
The google SRE book defined the term the four golden signals i.e latency, traffic, errors, and saturation.
Error Rate: Because errors immediately affect customers.
Response time: Because slow is the new down.
Throughput: The traffic helps you to understand the context of increased error rates and the latency too.
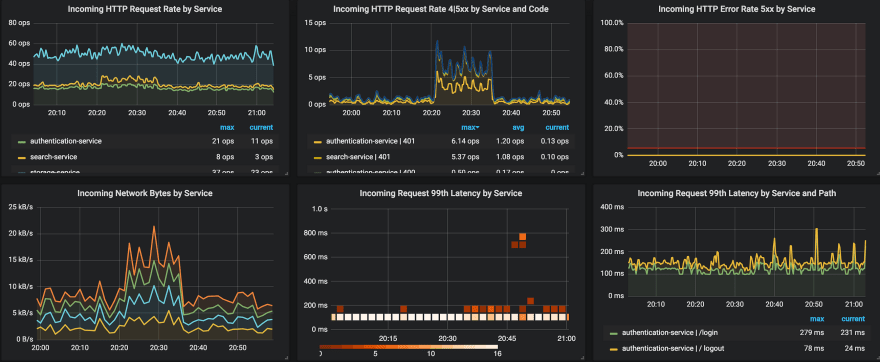
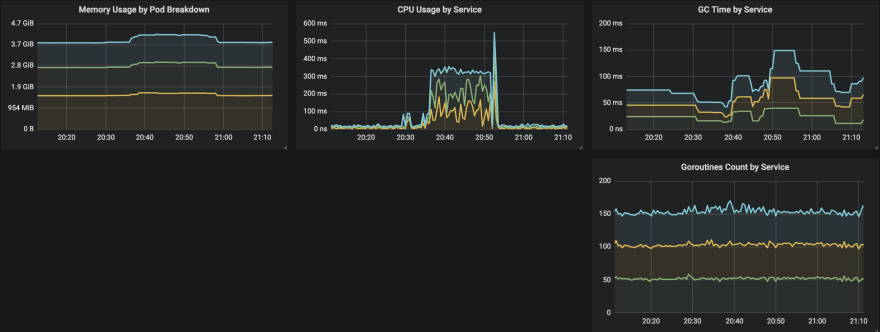
Saturation & Utilization: It tells how full your service is. If the Memory usage is 95%, can your response time keep stable? Processes: Threads Used, State, Running and Blocked, Disk I/O Utilization.
How can you monitor?
Prometheus is an open source toolkit that takes care of both metrics and alerting on a large scale. It’s currently the fastest growing metrics-based monitoring system on the planet.
Hosts metrics (CPU, Memory, Network & Disk I/O, and Process) are typically available on linux via procfs, they can be gathered via node_exporter prometheus integration. Prometheus manages to scrape their targets by calling /metrics endpoint on respective hosts.
The http throughput, error and response time metrics can be instrumented by prometheus client libraries. I strongly recommend looking at opencensus project from Google. It’s a collection of libraries that collects metrics and distributed tracing for services. Whenever either a http request reaches your service endpoints or your service performs outgoing requests, metrics and traces will be generated out of the box, it’s amazing. Last but not least, you can export metrics and traces for multiple backends simultaneously.
What to alert?
Effective alerts are hard to get, definitely not an easy task. Engineering teams must be sure to alert just enough to be aware of all problems detected by the monitored system while at the same time caring of potential excessive noise.
When to alert?
- Something is broken, and somebody needs to fix it right now!
Or
- Something might break soon, so somebody should look soon.
Ideally alerts should be sent when customers are affected. For online services i.e HTTP API servers, alert on conditions like high response times and high error rates as high up in the stack as possible, for example: If possible, use metrics from the load balancer and not from the service internals, if the service is down metrics aren't lost.
For capacity they should detect when hosts run out of resources that will lead to an outage, for example: DiskWillFillIn4Hours, SSLCertificateWillExpireIn2Days and so on.
Avoid paging on-call engineers on root causes or low thresholds, just to name a few examples: NodeCPUTooHigh, NodeMemoryTooHigh, ConnectionRefused. Instead do over symptoms, tell what’s broken and not why — TooManySlowCustomersQueries, TooManyCustomersCheckoutErrors, see table below:
| Symptom | Cause |
|---|---|
| Too many HTTP 500s or 404s | tcp connection timeouts, wrong reverse proxy configuration |
| Too many slow HTTP queries | CPUs are overloaded by node resource starvation |
It does not end here, alerts should link to relevant dashboards and consoles that answer the basic questions about the service being alerted.
Write Runbooks
Typically, a runbook contains procedures to troubleshoot systems. They should link to dashboards where service metrics, logs and traces can be found. Reduce MTTR (Mean Time to Resolve) by attaching runbooks to every alert o your system.
Conclusion
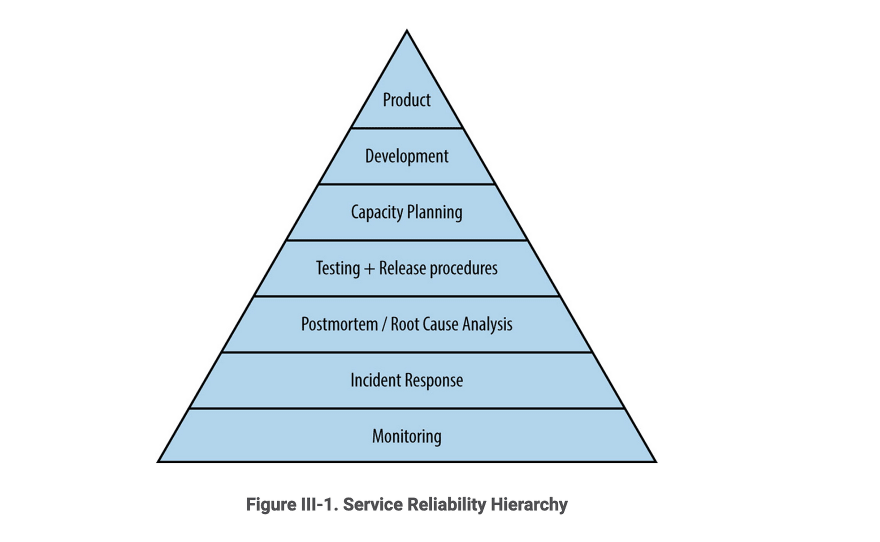
Monitoring is the bottom layer of the Hierarchy of Production Needs. It is a basic requirement to running a service in production, without it, service owners can’t tell whether the service is even working.
I recommend the reading of https://landing.google.com/sre/books
I hope you enjoyed, thanks!

Top comments (0)