Hey there, thanks for taking a look at the thoughts I'm letting flow into this drain I call a blog post. In truth, I'm just your average college sophomore at Penn State University Park, majoring in Data Science.
Okay, I have more of a life than what a title like that implies. I've been interested in several fields as a kid, like game development, psychology, and writing. In high school, I took an AP Statistics class as a sort of "well, why not" kind of thing, just to have more AP credit.
In the end, I realized how being able to use statistics to understand more about the world around us was actually fascinating. It's how we both document and predict events that happen. So where does that leave me now?
- Learning about databases to make use of this data
- Secretary of the Penn State Pokemon Society
- Looking to minor in Psychology
- Writing the blog post right now
So, in a way, I guess all those ambitions found me, one way or another. Hm.
Now that you know a bit about those ambitions, let's talk about the ambition I have to show you how Diagram.net works. Probably like, on a scale of 1 to 10, I'm at a 7 today? That's better than average. In any case, I'll be showing how to quickly produce a flowchart of decisions and paths, along with a small bit about how we can use a diagram representation to explain the differences of SQL and NoSQL.
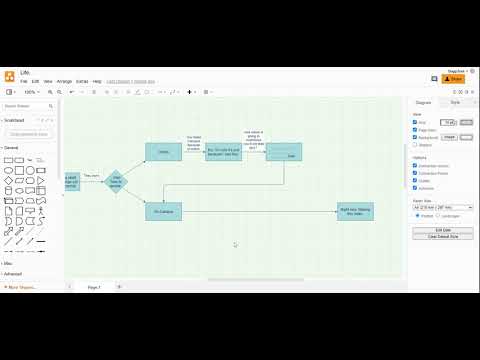
Of course, what I showed of SQL and NoSQL is just a small facet of their structure, and we won't be going in full depth on it quite yet, but as this is an IST class, I felt as though showing off diagrams.net would not suffice on its own.
The main takeaway to this is that diagrams.net is a great tool for structuring your pathing and data, as using and modifying directional arrows is often useful when you want to explain what relates to what in an SQL structure, but in NoSQL's more document by document representation, such relations must be made manually. Ultimately, both diagrams display the same data, but the structural differences derive from those connected/unconnected relations.
In SQL, it would be simple to create an line from an ID and then point at where it lies in a different table, and it simply means that whatever is represented inside that ID can be represented in that table by its ID number. The path from a "Shoe ID" to a "Pair ID" in a NoSQL world would require its data to be shown in the "Pair ID" as well, not just by its number. Diagrams.net can be used to represent both, either with connected cells to explain SQL data or cells spaced out to represent NoSQL data.
I hope that this entry will help you understand the basic features behind diagrams.net, and how simple it is to edit and create diagrams to explain your own concepts. Good luck to all my peers, and I'll see you in the next post.
Sources:
- diagrams.net
- SQL vs NoSQL or MySQL vs MongoDB by Academind: https://www.youtube.com/watch?v=ZS_kXvOeQ5Y
- SQL vs NoSQL: Which one is better to use? by Geeks for Geeks: https://www.geeksforgeeks.org/sql-vs-nosql-which-one-is-better-to-use/


Top comments (0)