Title
How to display "total" in the tooltip of a line chart?
Description
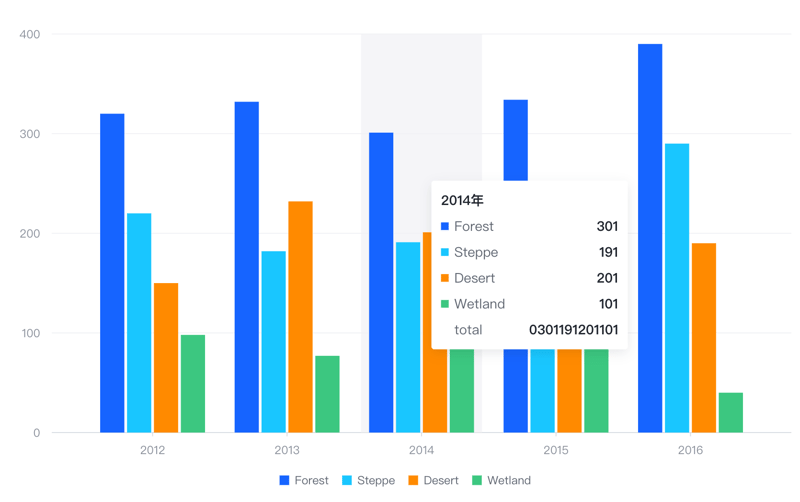
When using a line chart, I want to display the "total" item in the tooltip, but I don't know how to do it. How can I achieve this?
Solution
You can use updateContent to do post-processing of the tooltip content.
In the content of dimension, you can add an item with the key "total" and the value of a function. This function receives a datumList parameter, which represents the list of all data in the current tooltip. Then calculate the sum of the values of all data and return it.
In updateContent, you can also add an item with the key "total" and the same function, so that the "total" item can be displayed in the tooltip.
Code example
const data = [
  { year: '2012', type: 'Forest', value: 320 },
  { year: '2012', type: 'Steppe', value: 220 },
  { year: '2012', type: 'Desert', value: 150 },
  { year: '2012', type: 'Wetland', value: 98 },
  { year: '2013', type: 'Forest', value: 332 },
  { year: '2013', type: 'Steppe', value: 182 },
  { year: '2013', type: 'Desert', value: 232 },
  { year: '2013', type: 'Wetland', value: 77 },
  { year: '2014', type: 'Forest', value: 301 },
  { year: '2014', type: 'Steppe', value: 191 },
  { year: '2014', type: 'Desert', value: 201 },
  { year: '2014', type: 'Wetland', value: 101 },
  { year: '2015', type: 'Forest', value: 334 },
  { year: '2015', type: 'Steppe', value: 234 },
  { year: '2015', type: 'Desert', value: 154 },
  { year: '2015', type: 'Wetland', value: 99 },
  { year: '2016', type: 'Forest', value: 390 },
  { year: '2016', type: 'Steppe', value: 290 },
  { year: '2016', type: 'Desert', value: 190 },
  { year: '2016', type: 'Wetland', value: 40 }
];
const aggregation = {};
data.forEach(({ year, value }) => {
  if (!aggregation[year]) {
    aggregation[year] = 0;
  }
  aggregation[year] += value;
});
const spec = {
  type: 'bar',
  data: [{ id: 'bar', values: data }],
  xField: ['year', 'type'],
  yField: 'value',
  seriesField: 'type',
  bar: { state: { legend_hover_reverse: { fill: '#ccc' } } },
  legends: { visible: true },
  tooltip: {
    mark: {
      title: { value: (datum) => datum['year'] + '年' },
      content: [
        { key: (datum) => datum['type'], value: (datum) => datum['value'] },
        {
          hasShape: false,
          key: 'Proportion',
          value: (datum) => Math.round((datum['value'] / aggregation[datum['year']]) * 10000) / 100 + '%'
        }
      ]
    },
    dimension: {
      title: { value: (datum) => datum['year'] + '年' },
      content: [{ key: (datum) => datum['type'], value: (datum) => datum['value'] }],
      updateContent: (prev) => {
        console.log(prev);
        const total = prev.reduce((acc, cur) => {
          return acc + cur.value;
        }, 0);
        return (prev ?? []).concat({ key: 'total', value: total });
      }
    }
  }
};
const vchart = new VChart(spec, { dom: CONTAINER_ID });
vchart.renderAsync(); // Just for the convenience of console debugging, DO NOT COPY! window['vchart'] = vchart;
Result


Top comments (0)