tldr;
They're here! After a long time of people hoping and asking for some dev tools to work with their Angular apps, there is now a new Chrome extension for Angular dev tools. The Angular team has worked really hard on this, and I'm excited to introduce you to it in this blog post.
In short, the new dev tools extension will let you view the layout of your app in a tree-like structure. You can click on each component and see its properties, and see where exactly on the page that component is. Let's look at this a little more in depth.
Dev Tools Demo
Let's start with where you can get the dev tools. You can add the dev tools to your browser through the Chrome extension store.
After the dev tools are installed, open the Chrome developer tools panel and look for the "Angular" option and click on it.

This will show the dev tools for you, starting with the root component of your application.

There's not a lot here, due to my demo app being pretty simple, but the left half of the window shows the components of the app in a tree structure. Currently, it's all collapsed down to the app-root component. The right hand side shows the properties of the selected component. In this case, all there is to show is the change detection strategy and the view encapsulation. We'll look at other components with more information next.

In this image I opened up the app-root node of the tree so that we can see the app-nav component. I then clicked on the app-nav component. In the right hand side we can see the properties of the component. At the top we can see the view encapsulation again, as well as the change detection strategy. Underneath that are the class member variables for the component. In this case, it's an array of links to show in the navigation. Each link is opened up to see the attributes it contains.
This is another simple situation, but it demonstrates the potential power of the dev tools. Being able to see the properties of the component and the values of the properties is really powerful.
Let's look at another couple components in the app, this time the app-todos component and app-todo component.
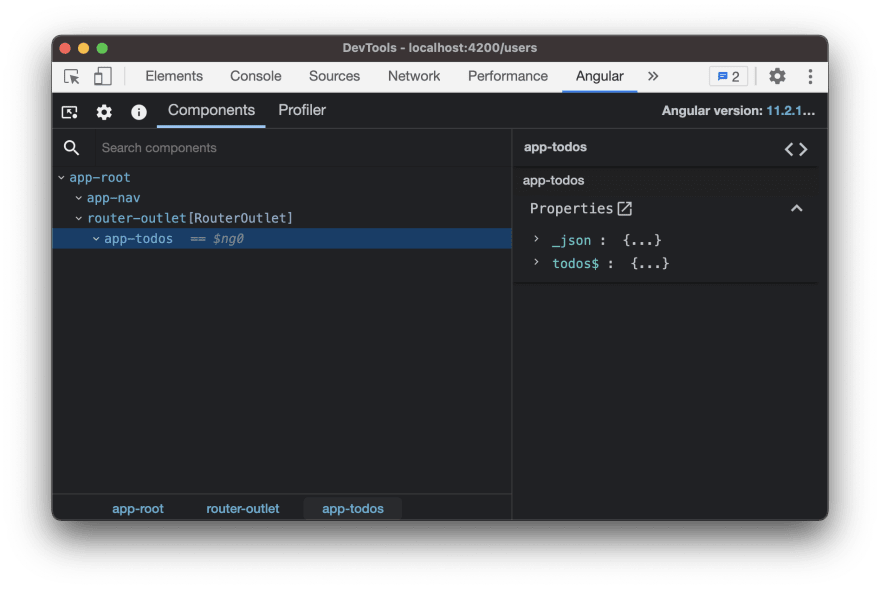
In this component, we see two properties: the injected _json service and the todos$ observable. I've clicked on the app-todos component, but there's nothing below it. There should be a list of todos, right? To get them to show up, you need to click on the cog right above the search components input.
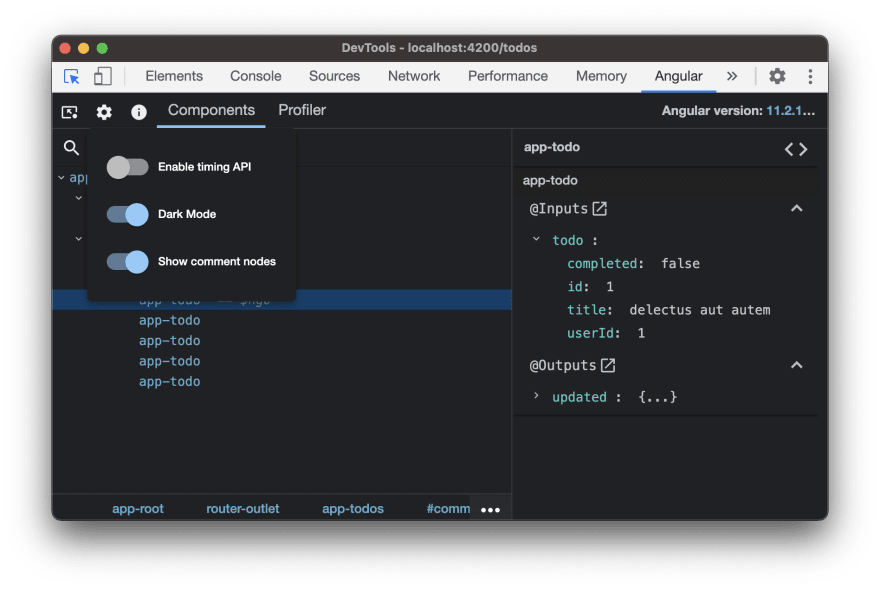
Clicking on the cog will open a small options menu. The items in the menu are "Enable timing API", "Dark Mode", and "Show comment nodes". The one we're interested in for right now is the "Show comment nodes" option. Selecting this option will make the app-todo components show up. Let's select a todo component and see what it looks like.

This component looks similar to some of the other ones that we've seen, but there are more attributes visible on the component. We can see the @Inputs and @Outputs, as well as the attributes available on those items. For the todo input, we can see the value of each attribute. Being able to drill down into components and see the values of the attributes is really beneficial and valuable.
The last part of the dev tools that I want to point out is the profiler, which will allow you to click around the app and then view information about a particular change detection cycle. The tools tell you how long it took, as well as which components were affected and how much they were affected in a given cycle. If your application is running slowly and you're unsure where the hold up is, this profiler can be a big help. Below are a few images of the profiler in action.
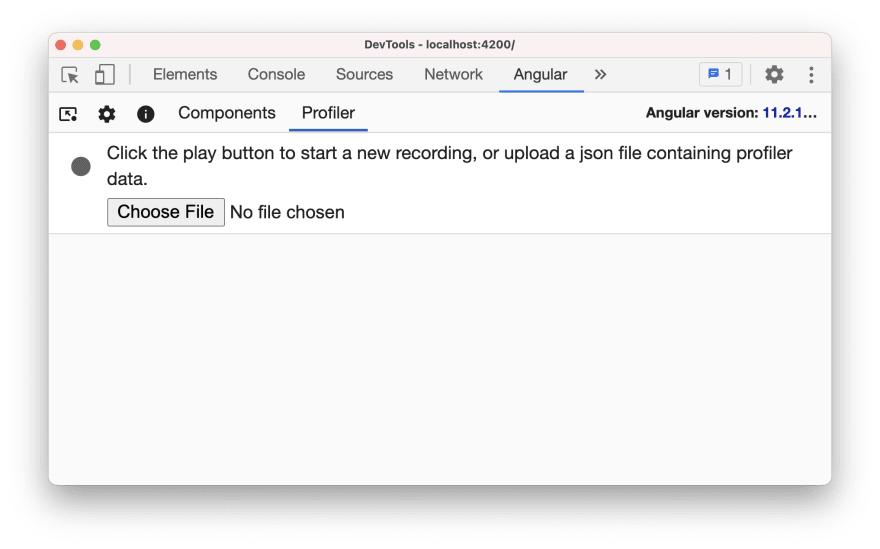
To view this starting page of the profiler, click on the "Profiler" tab next to components. After doing that, click on the gray button to the left of the information in the tab. This will start the recording, and the tools will update:

After starting the recording, click around your app. Each change detection cycle will be recorded by the profiler, and will be shown in a bar chart by default. Click on one of the bars to view more information about that cycle.

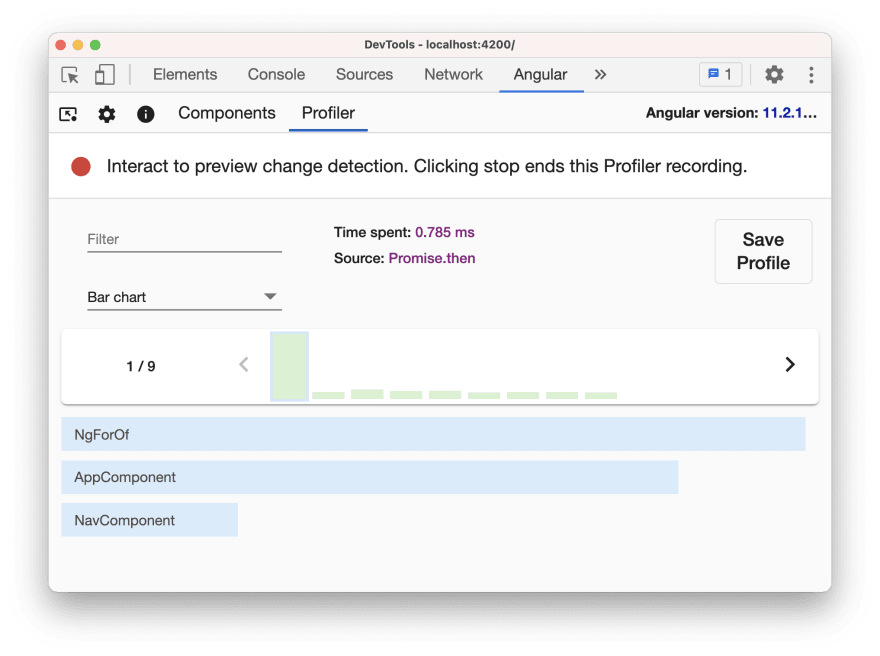
The detailed view shows you what actions took up certain amounts of time in each detection cycle that was run.
Once you're done, click on the red dot to end you profiler session.
Conclusion
I hope this brief introduction to the Angular dev tools is helpful! I'm really excited to have some dedicated tools to help debug and learn more about my Angular application. I'm sure more features will be added, and if there's a feature you would like check out the repo and submit issues and pull requests

Top comments (0)