![]()
Remote work has been top of mind for many companies recently, and technology managers are increasingly looking for analytical ways to motivate hiring remote team members.
The remote community is responding in force.
- Hiten Shah recently published an enormous volume of 250 remote work statistics to help remote advocates make the case for hiring remote.
- Buffer, Doist and We Work Remotely created a 2019 State of Remote Work report to reveal the biggest challenges and benefits with remote work amongst 2,500 survey respondents.
Yet, I noticed that there were no available tools to view remote work trends for US cities using official US Census Bureau data. Over the last two weeks, I spent hours formatting and displaying the data in a digestible way. You can test out my "U.S. Remote Work Trends" tool here.

In this article, I share 4 insights that I learned from using the application. But before I dive in, let's define some terminology from the application:
Remote Trend Score (RTS): a normalized score between 0 and 100 that quantifies the positive growth of the remote community in a city
Income Trend Score (ITS): a normalized score between 0 and 100 that quantifies the positive growth of median income levels for a city
If you're interested in knowing how ITS and RTS are computed, check out the "Data collection methods" section at the bottom of this article. With these terms in mind, here are a few insights about US cities that I learned from this data.
High income levels correlate with high remote populations
Cities with high income levels generally have higher remote work compositions. This intuitively makes sense. Remote work positions tend to be knowledge work that pays higher salaries, such as software engineering and accounting.

Relatedly, cities with higher Income Trend Scores (ITS) have correspondingly higher Remote Trend Scores (RTS). Put another way - the income level and the remote community of a city correlate strongly together.
Despite the discourse around remote work empowering the economies of rural, low-income communities in the US, remote work is still a privilege largely enjoyed by affluent areas.
Southern California beach cities have the highest remote populations
Southern California beach cities dominated 4 of the top 10 remote work locations. Encinitas, Carlsbad, Santa Monica and San Clemente have above a 7.5% remote working population, and all the cities are spread amongst San Diego, Los Angeles, and Orange counties. Unsurprisingly, these cities also have more than $86,000 in median household income.

Given the highly educated populations in these areas and the lifestyle benefits associated with temperate beach cities, I'm not surprised that these remote concentrations are so high. Given the positive upward trend of remote work in these cities (89.75 average RTS score), they will likely maintain their dominance amongst the top 10 remote cities for many years to come.

Cities with smaller remote populations tend to have industries with physical constraints
Cities with the lowest remote working populations tend to have industries with physical work constraints, such as agriculture and manufacturing.
Agriculture: Madera, CA (0.81% remote) and Porterville, CA (0.74%), both located in California's Central Valley, have significant populations of agricultural laborers.

Manufacturing: New Brunswick, NJ (0.44%) and Owensboro, KY (0.47%) employ most of their citizens in manufacturing roles that require in-person fabrication.

A common thread amongst the bottom 20 remote work cities is that blue collar labor is pervasive amongst the workforce.
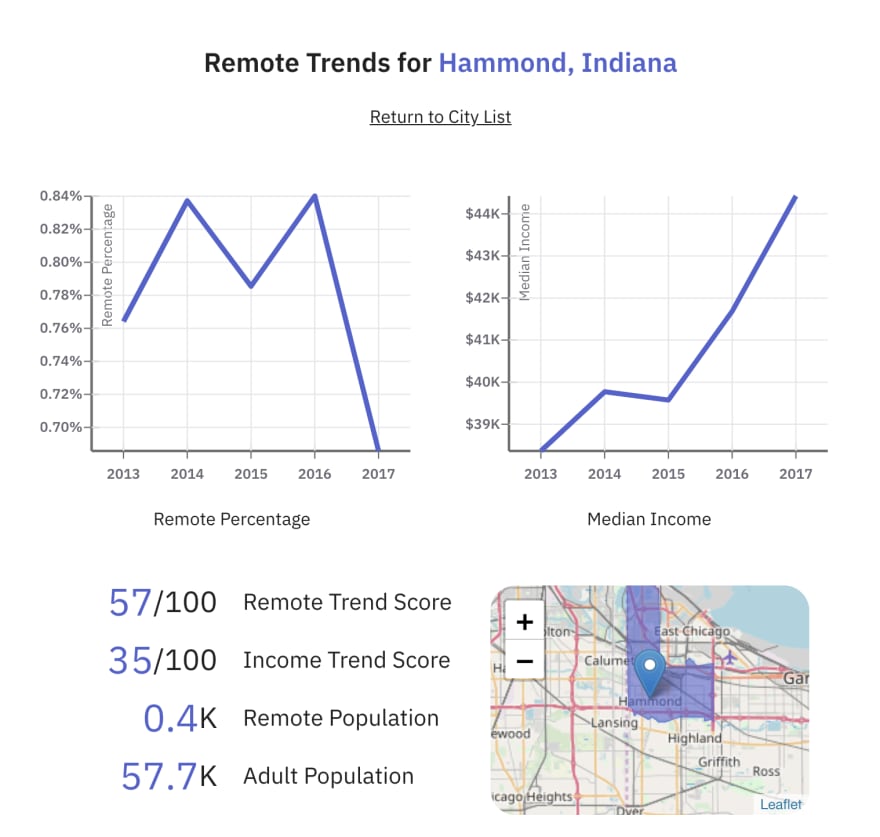
Cities with low remote populations are still losing their remote workers
While cities with the highest remote work percentages are increasing their share of remote workers (high RTS), the cities with the lowest remote work percentages are rapidly losing their remote workers (low RTS).
Counterintuitively, the majority of cities with declining remote populations (e.g. Sunrise Manor, Nevada and Hammond, Indiana) have increasing income levels (high ITS). I figured that higher income levels, often considered a sign of a tightening labor market, would give workers more leverage to negotiate working remotely.
<!--kg-card-end: image--><!--kg-card-begin: image-->

Frankly, I was stumped by this trend. At the risk of provoking criticism for reading too much into correlation, I have two (potentially inaccurate) conjectures to explain this phenomenon:
- Cities with low remote populations are blue collar, and blue collar cities are simply becoming even more blue collar as time passes.
- Remote workers feel less comfortable in cities with social centers (e.g. coffee shops or libraries) that feel less lively during the work day. That is a strong incentive to move or work onsite. Eventually, this becomes a feedback loop that contributes further to remote work declines.
Did you find any other interesting remote work trends using my tool? Share your findings with us on Twitter and we’ll add them to this list and mention you.
Data collection methods
I used data from the US Census Bureau’s American Community Survey (ACS) to create this interactive application.
The official census survey attempts to record every American household but is only conducted once every 10 years. To fill in the gaps, the bureau created the ACS to collect survey information from a representative group of 3.5 million Americans. ACS annual data is freely available online, dating from 2007 to 2017 for the 5-year estimate samples. To simplify the analysis, we removed cities with less than 40,o00 residents.
I consulted the official ACS documentation to find the necessary information and used the citysdk npm library provided by the Census Bureau development team to easily retrieve and process the data. These are the variables that I used as the basis for the application.
B08301_021E: Means of transportation to work (working from home)
B01003_001E: Total population
B09001_001E: Population under 18 years of age
B19013_001E: Median household income in the past 12 months
I then computed several properties from these base values.
Adult Population: populations of adults (18+) in the city
Remote Percentage: percentage of remote workers in the adult population.
Remote Trend Score (RTS): normalized score between 0 and 100 to quantify the trend of remote work adoption between 2013 to 2017.
To determine this score, I compute the linear regression of the remote percentages of a city from 2013 to 2017. Then, I take the linear coefficients of each city and normalize them between 0 and 100 using the least growing remote city (Columbia, SC) and most growing remote city (Encinitas, CA) as baselines.
Income Trend Score (ITS): normalized score between 0 and 100 to quantify the trend of income levels between 2013 to 2017.
I use the same methodology as RTS to compute ITS. I compute the linear regression and normalize the linear coefficients of each city relative to low and high income growth baselines (Corona, CA and Palo Alto, CA respectively).
Big shout out to Zhi Keng He and Logan Powell in the Census Bureau development team for helping me navigate the Census APIs. 🎊
Subscribe to our newsletter here! I'll continue to push interesting statistics and visualizations in future blog posts based on this census data. Let me know if you have any ideas for future posts or visualizations that I can create.
Are you a remote worker?
My biggest challenge with working remotely was communication and social isolation. I built Pragli as a virtual office for remote workers to communicate quickly and feel more present with their teammates. Sign up for Pragli and invite your teammates - it’s free!


Top comments (0)