Conduct an in-depth analysis of the full gc problem of the online business of the inventory center, and combine the solution method and root cause analysis of this problem to implement the solution to such problems
1. Event review
Starting from 7.27, the main site, distributors, and other business parties began to report that orders occasionally timed out. We began to analyze and troubleshoot the cause of the problem, and were shocked to find that full gc occasionally occurred online, as shown in the figure below. If you continue to let it go, it will inevitably affect the core link and user experience of Yanxuan trading orders, resulting in transaction losses. The development of the inventory center responds quickly, actively investigates and solves problems, and handles problems in the bud to avoid capital losses.


2. Emergency hemostasis
For frequent full gc, based on experience, we boldly guess that it may be caused by some interfaces generating large objects and calling them frequently. In an emergency, first ensure that the core functions of the system are not affected, and then troubleshoot the problem. Generally, there are three methods, as follows:
Expansion
There are generally two ways to expand capacity, one is to increase the size of the heap memory, and the other is to expand the capacity of the application machine; in essence, it is to delay the number and frequency of full gc occurrences, try to ensure the core business, and then troubleshoot the problem.
Limiting
Current limiting can be regarded as a kind of service degradation. Current limiting is to limit the input and output traffic of the system to achieve the purpose of protecting the system. Generally, current limiting can be done at the proxy layer and application layer.
Reboot
It is a relatively violent method. A little carelessness may cause data inconsistency. It is not recommended unless necessary.
Our application current limit is aimed at the application interface level. Since we don't know the specific cause of the problem and the problem is still in the bud, we don't directly limit the current, but directly expand the capacity and restart it incidentally. We temporarily expanded the heap memory in an emergency, increased the heap memory size of some machines from 6g to 22g, and restarted the application to make the configuration parameters take effect.
After emergency expansion of some machines (73 and 74) on 7.27, we can find that full gc did not occur within 2 days after the expansion, providing us with fault tolerance time for further investigation;

3. Problem analysis
3.1 Status Quo Challenges
Since there is no OOM, there is no on-site memory snapshot, so it is difficult to determine the cause of the problem, and the main inventory service involves too much logic (the core business logic has more than 100,000 lines of code, which are all running daily), and the business logic is complex. The volume is large, and there are a small number of slow requests, which increases the difficulty of troubleshooting. Since there is no relatively complete infrastructure, we do not have a global call monitoring platform to observe what happened to the application before and after the full gc. We can only find the truth of the problem by analyzing the link call situation on the problem machine.
3.2 Appearance reasons
Essentially, we need to look at what the application system does when full gc occurs, that is to say, what is the last straw that crushes the camel?
We have done a lot of analysis on the application logs at the time point before the full gc occurred, combined with the slow SQL analysis, as long as the business frequently operates the [internal and external procurement and outbound] business for a period of time, the system will trigger a full gc, and the time point is relatively consistent, so , the preliminary judgment may be caused by internal and external procurement and outbound business operations. Through the analysis of the business code analysis, it is found that the inventory change will load 100,000 pieces of data into the memory after intervention and interception, with a total of about 300M.
In this regard, we urgently contacted the dba on 7.28 to migrate part of the business data to other databases to avoid further impact on the business, and then optimize the business process in the future! !


After the migration, we found that there was no full gc on the day, and no business feedback interface timed out. On July 29, we found that machine 73 (upgraded configuration) did not have full gc, and machine 154 continued to have full gc on July 29. Observe every The amount of memory that can be reclaimed by a gc is not much, which means that the memory is not released in time, and there may be a leak problem!
3.3 Root cause of the problem
At that time, we dumped the memory snapshots many times, and did not find similar problems. Fortunately, the 155 machine was upgraded last (the backup machine, mainly used to process timing tasks, and was reserved for reference and comparison), which brought us closer to the root of the problem. because.
To further analyze the reason, we analyzed the heap memory snapshot of one of the machines (155), and found an interesting phenomenon, that is, there are a large number of threads blocking waiting threads;

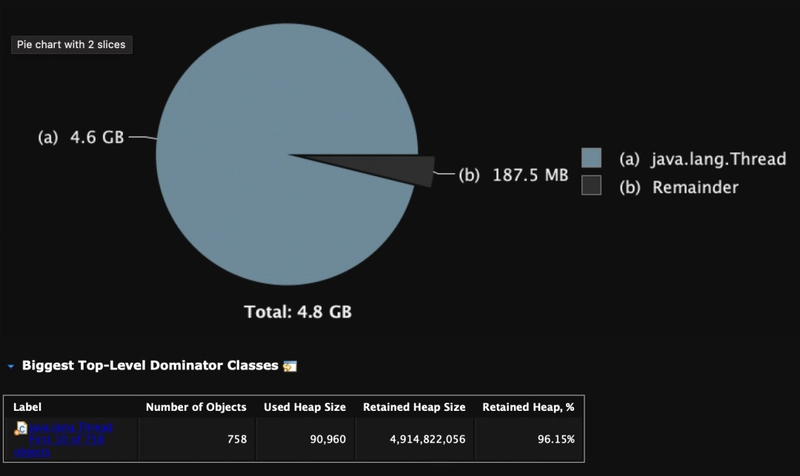
Each blocked thread will hold about 14M of memory. It is these threads that cause the memory leak. So far we have finally found the cause of the problem and verified our guess, that is, a memory leak has occurred!
3.4 Cause Analysis
3.4.1 Business Description
From 4.2, we locate the problem code. In order to facilitate our understanding of this part of the business (pull the SKU quantity information from the database, every 500 SKUs form a SyncTask, and then cache it in redis for use by other business parties, execute it every 5 minutes ) to give an overview.
3.4.2 Business code
3.4.2 Business code
@Override
public String sync(String tableName) {
    // Generate data version number
    DateFormat dateFormat = new SimpleDateFormat("YYYYMMdd_HHmmss_SSS");
    // Start the Leader thread to complete execution and monitoring
    String threadName = "SyncCache-Leader-" + dateFormat.format(new Date());
    Runnable wrapper = ThreadHelperUtil.wrap(new PrimaryRunnable(cacheVersion, tableName,syncCachePool));
    Thread core = new Thread(wrapper, threadName); // Create new thread
    core.start();
    return cacheVersion;
}
private static class PrimaryRunnable implements Runnable {
    private String cacheVersion;
    private String tableName;
    private ExecutorService syncCachePool;
    public PrimaryRunnable(String cacheVersion, String tableName,ExecutorService syncCachePool) {
        this.cacheVersion = cacheVersion;
        this.tableName = tableName;
       this.syncCachePool = syncCachePool;
    }
    @Override
    public void run() {
       ....
        try {
            exec();
            CacheLogger.doFinishLog(cacheVersion, System.currentTimeMillis() - leaderStart);
        } catch (Throwable t) {
            CacheLogger.doExecErrorLog(cacheVersion, System.currentTimeMillis() - leaderStart, t);
        }
    }
    public void exec() {
        // Query data and build synchronization task
        List<SyncTask> syncTasks = buildSyncTask(cacheVersion, tableName);
        // Synchronize task submission thread pool
        Map<SyncTask, Future> futureMap = Maps.newHashMap();
        for (SyncTask task: syncTasks) {
            futureMap.put(task, syncCachePool.submit(new Runnable() {
                @Override
                public void run() {
                    task.run();
                }
            }));
        }

        for (Map.Entry<SyncTask, Future> futureEntry: futureMap.entrySet()) {
            try {
                futureEntry.getValue().get(); // Block getting synchronization task results
            } catch (Throwable t) {
                CacheLogger.doFutureFailedLog(cacheVersion, futureEntry.getKey());
                throw new RuntimeException(t);
            }
        }
    }
}
/**
 * Deny Policy Class
 */
private static class RejectedPolicy implements RejectedExecutionHandler {
    static RejectedPolicy singleton = new RejectedPolicy();
    private RejectedPolicy() {
    }
    @Override
    public void rejectedExecution(Runnable runnable, ThreadPoolExecutor executor) {
        if (runnable instanceof SyncTask) {
            SyncTask task = (SyncTask) runnable;
            CacheLogger.doRejectLog(task);
        }
    }
}
The current queue size is 1000, and the maximum number of threads is 20, which means that the thread pool can handle at least 51w data, and the current number of sku is about 54w. If the task takes time, all remaining tasks may be put into the queue, and there may be threads Insufficient pool queue condition. Insufficient queue size will trigger the rejection policy. Currently, the rejection policy in our project is similar to DiscardPolicy (when a new task is submitted, it will be discarded directly without any notification to you)
From the analysis here, we summarize the causes of the problem as follows:
- First, when the task is submitted to the thread pool and the rejection policy is triggered, the state of the FutureTask is in the New state, and calling the get() method will reach LockSupport.park(this), blocking the current thread and causing a memory leak;
- The reason is that the thread pool is not used properly. There are two main problems. One is that there is a problem with the selection of the rejection strategy. Abnormal termination (in addition, there is no need to obtain task results in the project, and there is actually no need to use the submit method to submit tasks).
3.4.4 Getting to the bottom of it
After analyzing this point, we can say that we have found the cause of the problem, that is to say, when FutureTask gets the execution result, it calls LockSupport.park(this) and blocks the main thread. When will the current thread be woken up? Let's move on to the code.
That is, when the task currently assigned by the existing worker thread Worker is executed, it will call the getTask() method of the Worker class to get the task from the blocking queue, and execute the run() method of the task.
4. Problem solving
By optimizing the thread pool configuration and business process l, such as increasing the size of the thread pool queue, repairing the rejection strategy, optimizing the business process to avoid large objects, and executing tasks at off-peak times, a series of combined measures ensure the stable execution of tasks.
4.1 Thread pool configuration optimization
Increase thread pool queue size, fix rejection policy
4.1.1 Modify the deny policy
- The main purpose of the custom rejection strategy used in the project is to print out the task information contained in the rejection task, such as skuId, etc., and then manually update it to prevent abnormal inventory data provided to other services;
- From the previous article, we have already seen that the runnable type is FutureTask, so the if judgment in the picture will never be established. This custom rejection policy is like the default rejection policy in the thread pool. I will give you any notice, relatively speaking, there is a certain risk, because we did not know that this task would be discarded when we submitted it, which may cause data loss);
- After the modification, when the queue is full, the rejection strategy will be triggered immediately and an exception will be thrown, so that the parent thread will not be blocked all the time to obtain the result of the FutureTask.
ps: The Runnable in the thread is currently packaged in the project. If you use native classes, you can obtain the rejected tasks in the rejection policy through reflection. Just get the rejection task information, you can ignore it.
4.1.2 Increase the queue size
- The maximum number of threads in the thread pool is 20, the queue size is 1000, the current number of skus is 54w, and each task has 500 skuIds. If the execution time of each task is a little longer, it can only process 51w skus at most, plus 3 tasks Common thread pool, set the queue size to 3000;
- After the queue is adjusted, it can prevent some SKUs from not synchronizing the inventory data to the cache in time. 4.2 Business Process Optimization Optimize the large objects that appear in internal and external procurement to reduce the problem of requesting 300M large objects each time. At the same time, the execution time of the three scheduled tasks in the public thread pool is staggered to avoid mutual interference between tasks after the increase in sku.
- Summarize precipitation 5.1 Summary of full gc solutions
- What should we do when encountering frequent full gc online? The first thing that comes to mind is to deal with it urgently first, and then analyze the reasons. We have three options for emergency treatment: restart, current limit, and capacity expansion.
- Secondly, clarify the direction. Generally speaking, there are two main reasons for full gc, one is application resource allocation problems, and the other is program problems. In terms of resource configuration, we need to check whether the jvm parameter configuration is reasonable; most of the full gc is caused by program problems. There are two main reasons. One is that the program has large objects, and the other is that there is a memory leak;
- The most important point is to analyze the dump file, but to ensure that the memory snapshot at the time of the incident is obtained, the analysis software can use MAT and VisualVM. For the problem we encountered, we can actually use jstack to obtain all the threads of the current process for analysis;
- In case of full gc, a timely alarm should be issued to avoid the development response lagging behind the business. In addition, in practice, we should set JVM parameters reasonably, so as to avoid full gc as much as possible. In this troubleshooting, we also adjusted the jvm parameters, which will be discussed later Corresponding articles have been published.
5.2 Notes on using thread pool
- If you do not need to obtain task results synchronously, try to use the execute method to submit tasks, and handle exceptions carefully to prevent frequent destruction and creation of threads;
- If you need to use the submit method to submit the task, try to use the timeout method to obtain the result synchronously, so as to avoid the problem of memory leak caused by the continuous blocking problem;
- Use the rejection policy carefully, and be familiar with the possible problems in the combination of the rejection policy and the thread submission method. For example, DiscardPolicy and submit methods may cause blocking and waiting for results;
- Thread pool threads must be recognizable, that is, they have their own naming rules to facilitate troubleshooting.

Top comments (1)
Lessons from blood and tears on the production environment!!