
In my last post, I shared how much value the ELK stack could bring for your application in terms of the monitoring capabilities it gives you.
In this post, I will walk you through how to integrate your Go application with ELK, what are the different parts of ELK, how they work and how to create a basic configuration for them.
Let's jump straight in, shall we?
The Starting Point
First, make sure you have docker and docker-compose installed.
For docker, follow the installation instructions for your platform here.
For docker-compose, follow the installation instructions here.
Currently, the repo simply has a main.go file which logs random log lines on certain intervals. Occasionally, it propagates error log lines.
We will use this as a backbone to integrate the go app with ELK.
Setting Up the ELK Stack
ELK stands for Elasticsearch, Logstash and Kibana.
These are three different tools, created by the elastic company, which are typically used together to enable developers & sys admins to monitor production systems based on application or system logs.
There is one additional component the ELK stack, which is Beats.
Beats is a collection of small programs which are fine-tuned to gather different kinds of logging data - e.g. from files, from OS system logs, from Windows event logs, etc.
Since ELBK doesn’t sound as fancy as ELK, we still refer to the stack as the ELK stack.
In the following sections, we will explore each of these components separately & install them accordingly.
What is Elasticsearch?
Elasticsearch is a NoSQL database which is optimized for storing structured documents.
This database also has a REST API in order to easily interact with it.
A structured document is one which structures its metadata into JSON format.
This can be any JSON-serialized object. This can be used, for example, to create a user-facing search bar in your application.
Instead of doing manual & lame string processing of search terms, you can outsource this to elasticsearch which will do a much better job than both of us.
However, in our use-case, we will use Elasticsearch for storing structured logs. A structured log is one, which organizes its contents into a JSON object.
This is an example of an unstructured log:
This is an example of a structured log:
Using a structured log, you can later index into these keys and analyse bulks of your logs fast & seamlessly. This is exactly what the ELK stack provides.
Elasticsearch, in particular, will store this log line in a way optimized for search & analysis later.
Setting up Elasticsearch
To install elasticsearch, first create a docker-compose.yml file in the root of the repo and add this initial yaml:
Let’s break this config down.
In docker-compose, we enumerate the services we want to bring up in this manner:
In this case, we only bring up a single service which is called elasticsearch. You can choose any name you like, but this one is the most descriptive, given what it does.
Let’s now interpret the elasticsearch service config line by line.
This means that we are pulling an already setup docker image with the given version.
This enables us to not bother with setting up an image from scratch. Someone has already provided that out of the box, so we are reusing it.
Otherwise, you will have to bother with setting up the environment, installing dependencies, configuring them, installing elasticsearch manually, etc.
With this line, we are getting all this out of the box.
With this line, we are indicating that the local directory ./config/elasticsearch.yml will be mounted on /usr/share/elasticsearch/… in the container and it will be read-only (indicated by the ro flag).
The designated folder is where the elasticsearch default config directory resides.
The file ./config/elasticsearch.yml is not created yet, but we’ll create it soon.
This part designates that we will make health checks on the container by running the command:
The command will run periodically, every 3s with a 3s timeout.
We will do 10 retries in total and if all fail, docker marks this container as unhealthy and notifies dependent containers.
The final part of the configuration maps the container’s internal 9200 port to our real 9200 port:
This is all we need to add to docker-compose.yml for elasticsearch. Finally, add this configuration in ./config/elasticsearch.yml:
What this configuration means is that we will use single-node discovery mode.
Typically, elasticsearch runs in a cluster of nodes with masters & slaves in them which have to be configured.
To keep things simple & digestible for this exercise, we will use a single elasticsearch node.
The network.host option indicates that elasticsearch can bind to any network interface.
Starting Elasticsearch
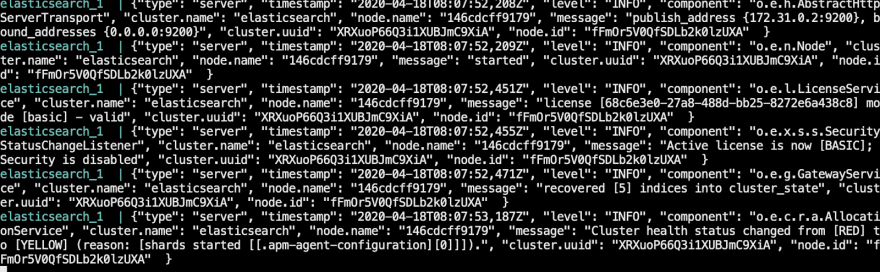
To boot up our new container, run docker-compose up.
If all went well, you should start seeing the elasticsearch logs after a while and the container should not show any error lines or anything pointing to an issue:
At this point, have in mind that there might be some issues which might pop-up.
Here is a reference to common issues on elasticsearch startup:
elasticsearch exit code 78
elasticsearch exit code 137
If all went went, you can continue with the next component in our stack - logstash.
What is Logstash?
Logstash is a component which stands between elasticsearch & applications and does several things:
- Filtering input documents based on some criteria (e.g. ignore all DEBUG log lines)
- Adding extra metadata to the input log lines (e.g. ip, location info, timestamp, etc.)
- Sanitizing the log lines if needed (e.g. turning unstructured logs into structured ones)
In reality, you can interact with elasticsearch directly, but logstash is typically used as a helpful intermediary to save yourself some work on the application side.
Setting up Logstash
Add another service to your docker-compose.yml file:
This config section is simpler than the previous one.
First, we use the standard logstash docker image as a baseline.
As before, we are mounting the ./config/logstash.conf file into logstash’s default config location.
Finally, the depends_on section indicates that this service should only boot up when the elasticsearch service is up and healthy.
Otherwise, the container won’t start at all.
Next up, add this logstash configuration in ./config/logstash.conf:
The logstash configuration typically has three sections - input, filter & output.
The input section specifies where logstash accepts data from. It has a built-in plugin called beats, which automatically integrates with beats applications, such as filebeat, which we’ll use later.
Here, we indicate that we’ll accept input from beats applications on port 5044.
In the filter section, you can add any custom filters or mappings (e.g. transforming one input field to another in a custom format).
Here, we only specify that the source structured log will come from the message field, which is the default key where filebeat stores the actual application log.
This will enable us to index the custom application keys in our log, not only the ones plugged in by filebeat and/or logstash.
The final output section specifies where the filtered logs should be forwarded to.
It can by default connect to elasticsearch (as we’ve done here) and integrate with it via its default port 9200.
If you change elasticsearch’s default port to something else, you will have to modify this section as well.
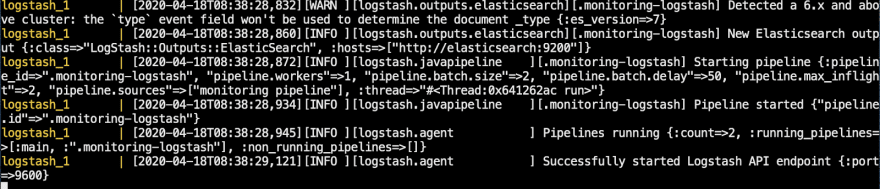
Now run both elasticsearch and logstash and make sure they both boot up without any issues:
If everything goes well, your output should look like this:
What is filebeat?
Filebeat is a beats application (there are more), which is responsible for monitoring changes in log files and forwarding them to logstash.
Without filebeat, you would have to manage your application’s integration with logstash yourself.
The way it works is - you specify a path to your logs which it should monitor & it will handle propagating those logs on regular intervals to logstash.
Setting up filebeat & your Go application
In this section, we will add filebeat & the Go application as docker containers.
Add this to your docker-compose.yml:
The bulk of the new sections are pretty similar to what we already did for the rest of our services.
Both new services depend on elasticsearch being healthy, both depend on their respective baseline docker images.
The differences are in the volumes sections.
For our go app, we’ve mounted the current directory in a subdirectory of the container’s GOPATH.
The logs, on the other hand, have been mounted in both containers.
Our Go application will use that directory to output its logging info.
The filebeat service will use it to monitor changes in the logging info.
In addition to that, we’ve mounted the filebeat configuration in the standard config directory on the container.
For our Go app, we’ve also specified that once the container is setup, we’ll run our application via the command:
Now, add this to config/filebeat.yml:
This configuration specifies that the service will listen for changes to all log files in /logs. Additionally, It will output any new logging info to logstash via port 5044.
We also whitelisted that port in our logstash service config for inputs from beats applications.
What is Kibana?
The final piece of the setup is Kibana. It is a front-end for analysing the data stored in Elasticsearch.
With it, you can visualize a huge array of data via graphs, pie charts, data tables, etc, in order to monitor what’s happening in your application via its logs.
You will see this in action in the final section of this exercise.
Setting up Kibana
Add this final piece of config to your docker-compose.yml file:
There is nothing new in this configuration section.
It installs the baseline docker image, depends on elasticsearch, has a health check of its own and maps its internal port 5601 to the machine’s real port 5601.
In addition to this, you can, optionally, add a dependency of your golang application on kibana to make sure your entire container stack boots up only after Kibana’s server is ready:
Now, test that everything works properly by running docker-compose up.
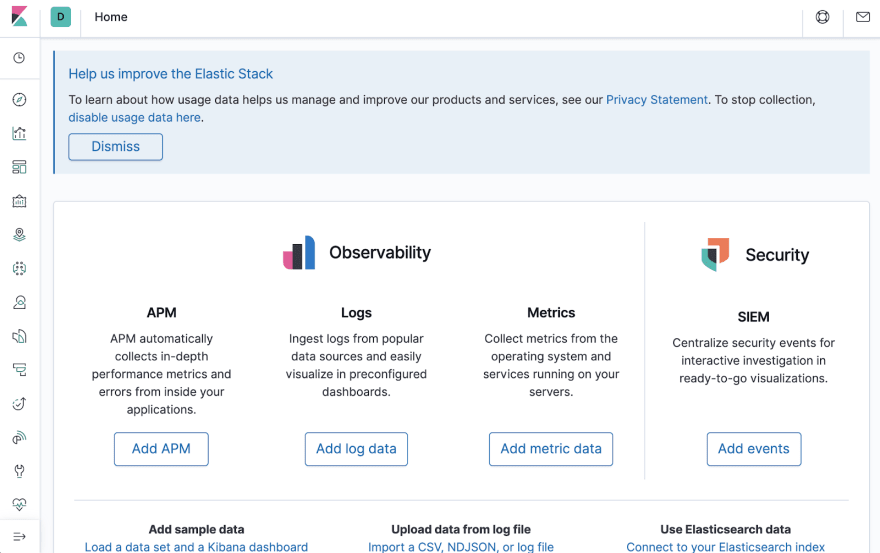
Now, you should be able to go to http://localhost:5601/app/kibana and see Kibana’s home page load.
If you didn’t do that last optional step, you might have to wait awhile before Kibana boots up:
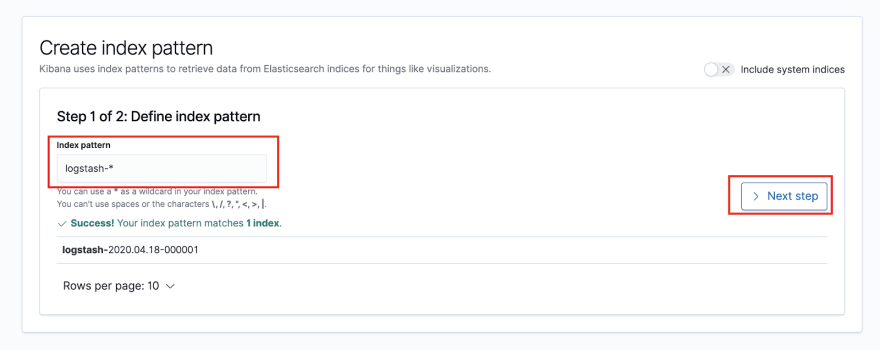
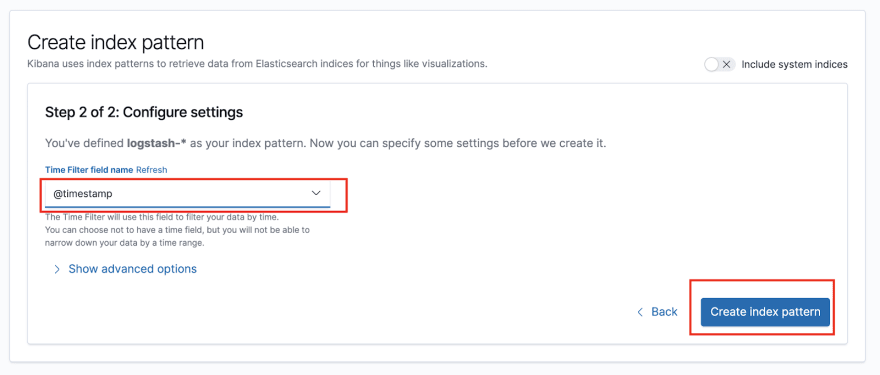
If you instead get asked for defining an Index Pattern, use logstash-*:
On the next step, select @timestamp as a time filter:
This finishes the Kibana setup.
In the final section, we will test that everything is integrated correctly by searching through our application logs via Kibana.
Search through your logs via Kibana
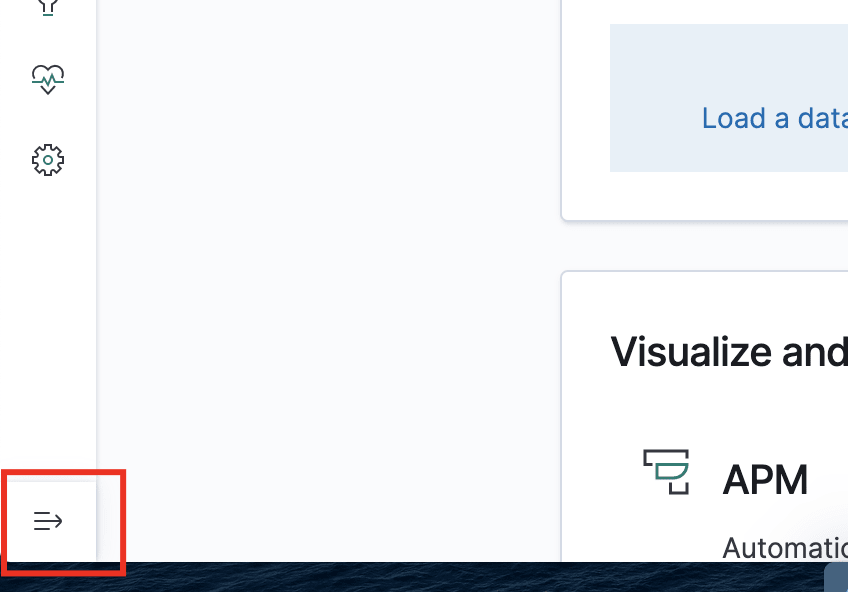
Open Kibana and expand your tabs first in the bottom-left corner of the site:
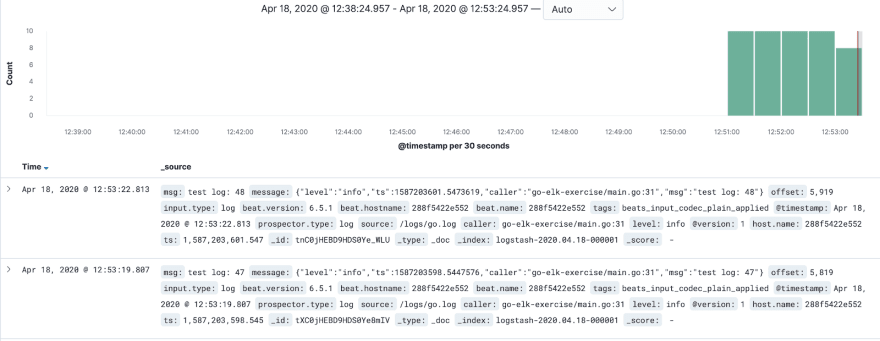
Next up, open the Discover tab:

After you open it, you should see all your logs here:
Filter only the application log fields on the left:
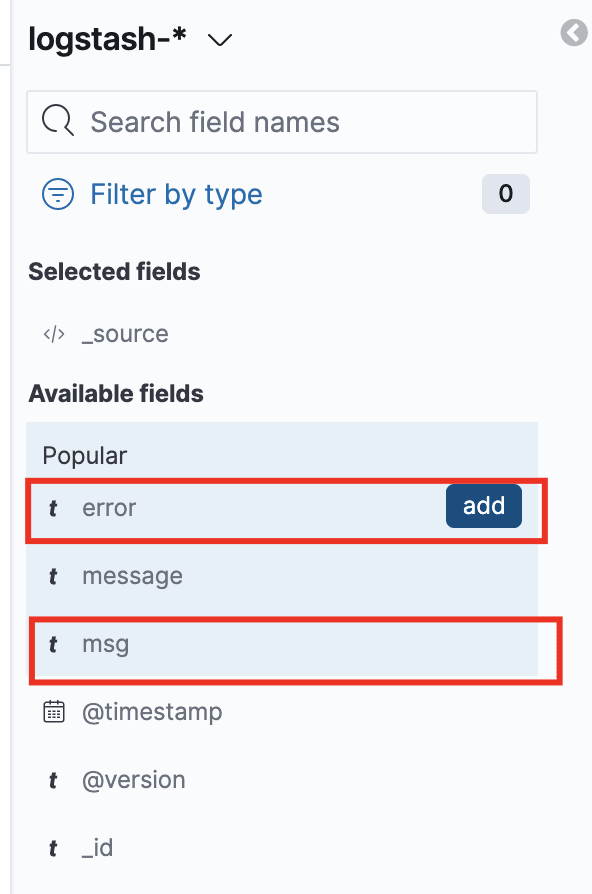
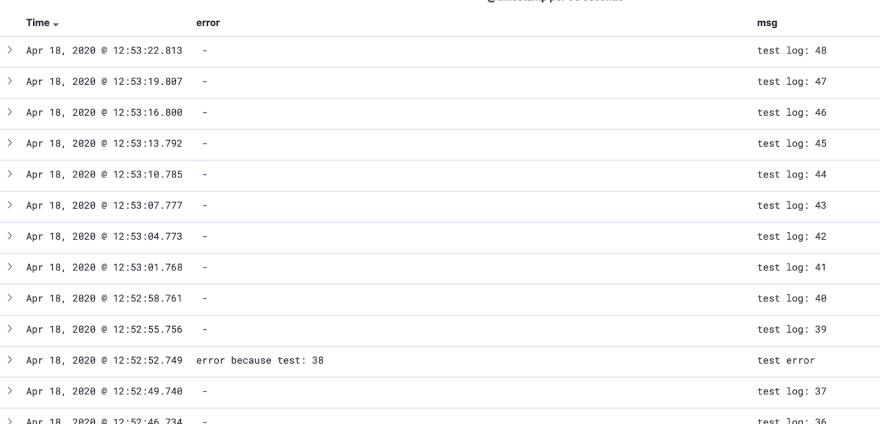
And voila, you should be able to see all your application logs:
Conclusion
This wraps up the tutorial to integrate a Go service with the ELK stack.
You should now have a good understanding of how the ELK stack works & each of its different components. Additionally, you should now have a good grasp of how to configure your ELK setup correctly & wire it to your Go application.
From here, you can start playing with Kibana by setting up useful dashboards based on your data.
Watch out for a follow-up tutorial for doing just that!

Latest comments (2)
Thanks for detailed tutorial @pmihaylov !
For local dev environment I'm using Dockerized ELK Stack. It saves me a lot of time of initial setup and configuration.
The Elastic stack (ELK) powered by Docker and Compose.
Elastic stack (ELK) on Docker
Run the latest version of the Elastic stack with Docker and Docker Compose.
It gives you the ability to analyze any data set by using the searching/aggregation capabilities of Elasticsearch and the visualization power of Kibana.
Based on the official Docker images from Elastic:
Other available stack variants:
Contents
Thanks for sharing this!
I wasn't aware of that project, I'll take a look.