Google Sheets is a pretty awesome spreadsheet program. I use it a lot for work and personal stuff.
I decided I wanted to pull in some of my stats from Dev.to into a Google sheet and found it to be easy.
Note: Don't want to write out the code? Get it here
So here's how you can do it for your stats.
Step 1: Get your API Key
You can locate this in your profile on Dev.To. Go to your settings.
Your API key will be under "Account."
Getting Published Articles
The API is simple. You can use something like Postman to test it out, using the URL and your API key:
https://dev.to/api/articles/me/published?per_page=50
If you see this, your URL works! You can change per_page to whatever you'd like.
Create the Spreadsheet
Create a Sheet in Google Sheets that looks like this:
Here I have a sheet that lists
- Title
- Published
- Total Views
- Reactions
- Comments
These will all be auto-populated from the API.
Click on Tools -> Script editor to open up the Script editor.
Code To Pull Data
In the script editor, you'll see the code.
function myFunction() {

}
We're going to replace the function with ours. As soon as you change the code, you'll see a prompt asking you to edit the project name. You can put whatever you want here.
Next, we want to create a function. This function will get the first empty row of the spreadsheet we just created:
function getFirstEmptyRow() {
    var spr = SpreadsheetApp.getActiveSpreadsheet();
    var column = spr.getRange('A:A');
    var values = column.getValues(); // get all data in one call
    var ct = 0;
    while (values[ct][0] != "") {
        ct++;
    }
    return (ct);
}
Next, we'll create a function that formats the time to look better. The timestamp from the API is useful, but a bit ugly. This fixes that.
function formatDate(timestamp) {
    var year = timestamp.substring(0, 4);
    var month = timestamp.substring(5, 7);
    var day = timestamp.substring(8, 10);
    var newdate = month + "/" + day + "/" + year;
    return newdate;
}
You'll notice much of this code is JavaScript. I was able to build this without even looking anything up to see if it would work in Google Sheets. I would guess there are a lot of things you can do here with JavaScript.
Finally, let's drop in the main function that will be getting our stats:
function getStats() {

    var options = {
        "access-control-allow-headers": "Content-Type",
        "api-key": "[YOUR API KEY]"
    }
    var header = {
        'headers': options
    }

    try {
        // make the API call
        var response = UrlFetchApp.fetch("https://dev.to/api/articles/me/published?per_page=500", header);
        // parse output as JSON
        var output = JSON.parse(response.getContentText());
        // grab the spreadsheet tab
        var sheet = SpreadsheetApp.getActiveSpreadsheet().getSheetByName('[ TAB NAME ]');

        output.forEach(function(row, index) {
            sheet.getRange(index + 2, 1).setValue(row.title);
            sheet.getRange(index + 2, 2).setValue(formatDate(row.published_timestamp));
            sheet.getRange(index + 2, 3).setValue(row.page_views_count);
            sheet.getRange(index + 2, 4).setValue(row.positive_reactions_count);
            sheet.getRange(index + 2, 5).setValue(row.comments_count);
        });

    } catch (err) {
        throw new Error(err);
    }
}
Make sure to replace [TAB NAME] with the name of the tab the spreadsheet lives in.
What this function does:
- Makes the API call
- Parses the JSON that returns
- Gets the Active spreadsheet by the name
- loops through each published article
- sets a value from each article into a row in Google Sheets
Save the file, then select the function (getStats) from the top and run it:
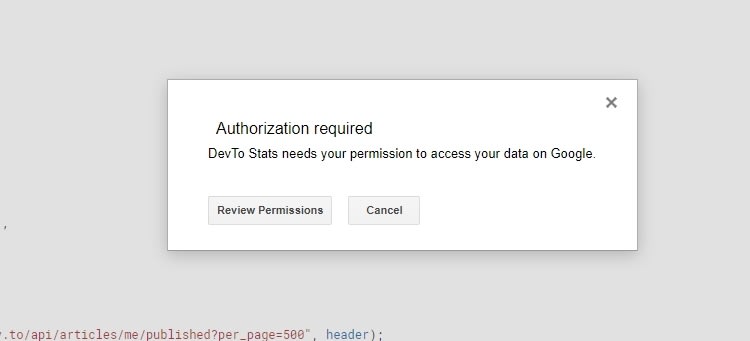
The first time you run it, it will ask for your permission:
Authorize it, and the script will run. It should look something like this:
Congrats! Now you can sort and filter and do cool spreadsheet stuff.
Create a Button
I wanted to create a button for this so I don't have to go into the script editor every time. It's pretty easy.
Go to Insert and select Drawing:
Draw some sort of button, and save it.
Now, it will be inserted into your spreadsheet. Click the three dots in the upper right-hand corner and select "Assign script."
In the next window, type in getStats and save it.
Now you have a button to refresh it any time you want.
You're Finished!!
So in this tutorial we:
- Grabbed an API key
- Tested our Dev.TO url
- Created a spreadsheet
- Wrote code to populate the spreadsheet with stats
- Built a button to update it.
There are a lot of cool things you can do here. You can build charts, perform analysis, etc. All kinds of cool stuff.
You can get the Full source code here.
If you use this, or expand on it let me know what you build! I'm curious to see how the authors on Dev.To use this functionality.


Top comments (4)
Awesome post! I just implemented my own version to gather the statistics in the way I wanted them and it's so easy!
This is not only a tutorial on how to gather statistics from DEV, but actually how to develop useful scripts for Google Sheets.
Thanks for sharing!
Just a comment: the function
getFirstEmptyRow()is not being used in the script at all.This is pretty handy, we have some data in elastic search and it’s been a manual job generating reports from it. Something like this would be great to pull that elastic search data into a document
Thanks for the post, this is a cool idea. For me at least, the gist is missing some code in getStats() between line 38 and line 40. The inside of the forEach is missing.
Thank you! Not sure how those got stripped out, but I fixed it.