If you’re a developer or engineer that’s integrated any PayPal functionality in your work, you’re likely already familiar with our developer dashboard. If not, the idea is that it’s a place to get relevant information and resources to support you in your dev efforts. From inception to integration to post deploy management, the dev dashboard is an important resource in your PayPal dev lifecycle.
This is why we’re so excited to announce the release of a new version of the PayPal dev dashboard!
With this update we’ve added new features and a host of improvements and new features to make the dev experience smoother, more intuitive, and more effective. I’m excited to highlight a few of the features here, with a variety of content and deep dives to follow, so keep your eye out.
Onboarding Banner
For those looking to get started, or for what the next step in your integration process might be, never fear, we’ve got you covered. This new version of the developer dashboard features a newly created “Onboarding Banner” to help guide you through the process of implementing an integration and getting your project up and running quickly and easily. It highlights recommendations for a handful of different scenarios and gives you access to the relevant quick links for functions and documentation to get you moving quickly and easily.

Sandbox and Live, Better Together
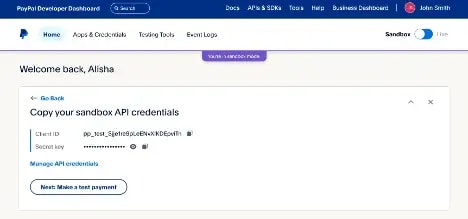
I for one know that when I’m building just about anything online the less tabs, windows, and apps I need to juggle, the better. Now, within the developer dashboard, we’ve integrated a slick toggle at the top right to allow you to seamlessly view your assets in either the Sandbox or Live environments within the same window.
No more need for multiple tabs and juggling apps to compare or confirm info. Now track all the info you need in one browser with a simple toggle.

To help avoid any confusion, there is a built-in banner for the dashboard to help ensure you know when you’re in sandbox mode.
![]()
Even better, this isn’t just for asset viewing or identification. You’ll get a full view of what is happening in the current state of either environment when switching back and forth.

With built in views of overall errors and transactions, API specific requests and errors, as well as webhooks info, you’ll have at-a-glance reporting about the most important metrics in your environment regardless of which setting you’re on, Sandbox or Live.
Global Date/App Selection
We understand that the development lifecycle is not a single moment in time, but instead a journey. To make this easier for us all, we’ve highlighted the date and app selector on the home page. It’s now easier than ever to navigate to a point in time in your integration experience to look at how things were performing and any relevant info that might help your dev experience.

Frequently Used Links
Let’s be honest, in any integration project there are at least a few, and often many different pieces of info to keep track of, while fitting the pieces together. These things can be spread across several sites and pages, and it can sometimes be a bear to manage all of them. To help, we’ve put together a list of what we believe to be some of the most important, commonly referenced items in the dev process all in one place on the new developer dashboard.

This allows you one click access to everything needed to get the job done, from your API credentials to your Webhooks Events, and even Test Credit Card info. Saving time and brain space is always a win, and getting to manage less silos of information in the dev process? Golden.
Deeper API Information
Once you’re past the initial steps of getting your integration in place, you can turn your focus towards performance both in terms of efficiency and success, and for that you need logging info. Specifically, you’d probably like to see what requests are coming through or being generated by your integration, and the status of them.
We’ve got you covered! We’ve always had solid API Call info, but we’ve enhanced this functionality even more to provide more details in a more compact format.
Drill directly into the event logs section to dig into your API Requests for a view of successes, failures, and details about each request you’re seeing. No need for guessing when clarity is one click away in the new dev dashboard.

What’s Next?
There’s so much more to cover from look and feel to function, and we’ve got new releases happening monthly with the next phase starting in January 2023. Keep an eye out for all the new goodness coming your way after this release. But for now, the next step is to go try it out!
So go build stuff, try it out, and let us know!

Latest comments (0)