
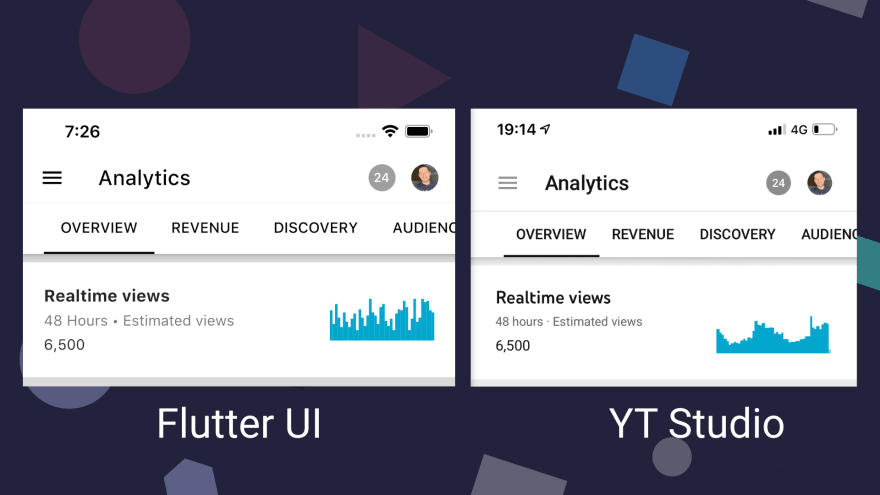
In this article we're going to look at how to replicate the Sparkline Bar Chart as seen in the Realtime Views section of the YouTube Studio application. This is quite a common chart and represents datasets at a small scale, allowing you to see results at a glance.
Video
Prefer to watch a video? Here's one I made for this article:
Here's an example of the UI we'll be making in comparison to the YouTube Studio application:
NOTE: I'm still learning how to best take advantage of the
CustomPainterandCanvaswith Flutter and I'm documenting my learning here. I'd love your feedback!
Project Setup
With that in mind - let's make a new Flutter project in the terminal:
# New Flutter project
$ flutter create flutter_sparkline

# Open in VS Code
$ cd flutter_sparkline && code .
We'll then create a new page at presentation/pages/home_page.dart named HomePage:
import 'package:flutter/material.dart';

class HomePage extends StatelessWidget {
  @override
  Widget build(BuildContext context) {
    return Scaffold(
      body: Center(
        child: Text("Hello, Flutter!"),
      ),
    );
  }
}
We can then update our main.dart accordingly:
import 'package:flutter/material.dart';
import 'package:flutter_sparkline/presentation/pages/home_page.dart';

void main() {
  runApp(MyApp());
}

class MyApp extends StatelessWidget {
  @override
  Widget build(BuildContext context) {
    return MaterialApp(
      title: 'Sparkline',
      theme: ThemeData(
        visualDensity: VisualDensity.adaptivePlatformDensity,
        primaryColor: Colors.black,
      ),
      debugShowCheckedModeBanner: false,
      home: HomePage(),
    );
  }
}
Building the Sparkline
In order to build our Sparkline Chart we're going to use the CustomPaint widget which takes a CustomPainter which we'll define as SparklinePainter at lib/presentation/painters/sparkline_painter.dart:
import 'dart:math';

import 'package:flutter/material.dart';

class SparklinePainter extends CustomPainter {
  List<num> data;
  Color color;

  SparklinePainter({@required this.data, this.color});

  @override
  void paint(Canvas canvas, Size size) {
    num index = 0;
    num barSize = size.width / data.length;
    num maxValue = data.reduce(max).toDouble();

    for (num point in data) {
      num barHeight = (size.height * point / maxValue).roundToDouble();

      _drawBar(
        canvas: canvas,
        left: barSize * index,
        top: size.height - barHeight,
        width: barSize,
        height: barHeight,
      );
      index++;
    }
  }

  _drawBar({Canvas canvas, num left, num top, num width, num height}) {
    Paint paint = Paint()
      ..color = color ?? Colors.red
      ..style = PaintingStyle.fill
      ..strokeWidth = 8.0;

    Rect rect = Rect.fromLTWH(left, top, width, height);

    canvas.drawRect(rect, paint);
  }

  @override
  bool shouldRepaint(CustomPainter oldDelegate) => true;
}
We can break the above down by the following steps:
- We're getting our initial set-up data such as the
barSize(depending on how many data points there are). We're also getting themaxValuefrom thedatapoints passed in. This will be used to determine ourbarHeightin a moment. - For a particular list of numerical data (i.e.
[1, 2, 3, 4, 5]), firstly, determine thebarHeightfrom a0-heightscale. - Then we're drawing a
Recton screen with our specified coordinates. - Finally, we're incrementing our
indexin order to move the nextRectalong one.
Now that we've got our SparklinePainter, we can use this inside of our SparklineChart widget:
import 'dart:math';

import 'package:flutter/material.dart';
import 'package:flutter_sparkline/presentation/painters/sparkline_painter.dart';

class SparklineChart extends StatelessWidget {
  @override
  Widget build(BuildContext context) {
    return Container(
      height: 40,
      width: 100,
      child: CustomPaint(
        painter: SparklinePainter(
          color: Color(0xFF00a7cf),
          data: List.generate(
            40,
            (index) {
              Random rnd = Random();
              return rnd.nextInt(20) + 6;
            },
          ),
        ),
      ),
    );
  }
}
This currently generates some fake dummy data using List.generate, but feel free to swap out the data with some of your choosing.
YouTube UI
Now all we need to do is update our HomePage with some crude UI code that represents the top of the YouTube Studio app:
import 'package:flutter/material.dart';
import 'package:flutter_sparkline/sparkline_chart.dart';

class HomePage extends StatelessWidget {
  @override
  Widget build(BuildContext context) {
    return DefaultTabController(
      length: 5,
      child: Scaffold(
        appBar: buildAppBar(),
        backgroundColor: Colors.white.withOpacity(0.85),
        body: Column(children: [
          SizedBox(
            height: 8,
          ),
          buildRealtimeSparklineCard(),
        ]),
      ),
    );
  }

  Container buildRealtimeSparklineCard() {
    return Container(
      color: Colors.white,
      child: Padding(
        padding: const EdgeInsets.all(20.0),
        child: Row(
          mainAxisSize: MainAxisSize.max,
          mainAxisAlignment: MainAxisAlignment.spaceBetween,
          children: <Widget>[
            Column(
              mainAxisAlignment: MainAxisAlignment.center,
              crossAxisAlignment: CrossAxisAlignment.start,
              children: <Widget>[
                Text(
                  "Realtime views",
                  style: TextStyle(fontWeight: FontWeight.bold, fontSize: 16),
                ),
                SizedBox(
                  height: 6,
                ),
                Text(
                  "48 Hours • Estimated views",
                  style: TextStyle(color: Colors.black54, fontSize: 12),
                ),
                SizedBox(
                  height: 6,
                ),
                Text("6,500"),
              ],
            ),
            SparklineChart(),
          ],
        ),
      ),
    );
  }

  AppBar buildAppBar() {
    return AppBar(
      title: Row(
        mainAxisAlignment: MainAxisAlignment.spaceBetween,
        children: <Widget>[
          Text("Analytics", style: TextStyle(color: Colors.black)),
          Row(
            children: <Widget>[
              Container(
                padding: EdgeInsets.all(6),
                decoration:
                    BoxDecoration(color: Colors.grey, shape: BoxShape.circle),
                child: Text(
                  "24",
                  style: TextStyle(color: Colors.white, fontSize: 12),
                ),
              ),
              SizedBox(
                width: 14,
              ),
              CircleAvatar(
                maxRadius: 13,
                backgroundImage: NetworkImage(
                  "https://yt3.ggpht.com/a-/AOh14GhB7xAslx6hmlYqG9-NDLyRj8ycHFUn7ypBMXv52Q=s288-c-k-c0xffffffff-no-rj-mo",
                ),
              )
            ],
          )
        ],
      ),
      centerTitle: false,
      brightness: Brightness.light,
      leading: IconButton(
        icon: Icon(Icons.menu),
        onPressed: () {},
      ),
      bottom: PreferredSize(
        preferredSize: Size.fromHeight(40.0),
        child: Column(
          children: <Widget>[
            Divider(
              height: 2,
            ),
            Container(
              margin: EdgeInsets.only(left: 20),
              child: TabBar(
                isScrollable: true,
                indicatorColor: Colors.black,
                tabs: [
                  Tab(
                    child:
                        Text("OVERVIEW", style: TextStyle(color: Colors.black)),
                  ),
                  Tab(
                    child:
                        Text("REVENUE", style: TextStyle(color: Colors.black)),
                  ),
                  Tab(
                    child: Text("DISCOVERY",
                        style: TextStyle(color: Colors.black)),
                  ),
                  Tab(
                    child:
                        Text("AUDIENCE", style: TextStyle(color: Colors.black)),
                  ),
                  Tab(
                    child: Text("INTERACTIVE CONTENT",
                        style: TextStyle(color: Colors.black)),
                  ),
                ],
              ),
            ),
          ],
        ),
      ),
      iconTheme: IconThemeData(color: Colors.black),
      backgroundColor: Colors.white,
    );
  }
}
Here's the final results of our work:

Summary
In this article we looked at how to create a Sparkline chart with the Flutter CustomPainter. I hadn't used the CustomPainter or Flutter Canvas before this, so it was a fun experiment!
I'd love to hear your thoughts on Twitter or in the comments.
Code for this article: https://github.com/PaulHalliday/flutter_sparkline


Top comments (1)
Haven't explored anything with custompainter yet. This seems like a good place to start. Good walkthrough.