"My program doesn't work, is this a bug in GCC/Clang/$TOOL?"
Everyone's had this moment before. You've been stumped on a problem for hours and are so sure that your tools are broke. You've quadruple-double-extra checked your logic. Have I found an error in $POPULAR_TOOL? You inquire on some message board. Then a grizzled greybeard appears, points out the flaw in your logic, and remarks that it's never a compiler error. Generally that's true, it's almost always your fault. That's not to say that compilers and debuggers and such don't have bugs, but after being used for many years by tens/hundreds of thousands of people, you really have to saunter off the beaten path to find one.
Well, I found one.
The Beaten Path
I'm writing a 32-bit loader for a 64-bit microkernel. I'm emulating it with QEMU, and debugging with GDB. I'm focusing on robustness and correctness, I want a complete mental picture at every stage. So I started off at the very beginning debugging a simple assembly function calling a C++ one:
boot:
    cli
    mov esp, stack_top
    push ebx ; grub stores an address to multiboot headers in ebx
    call startup
extern "C"
void startup(uint32_t foo) {
    doStuffWithFoo(foo);
}
Let's stop at the call to startup and examine the registers.
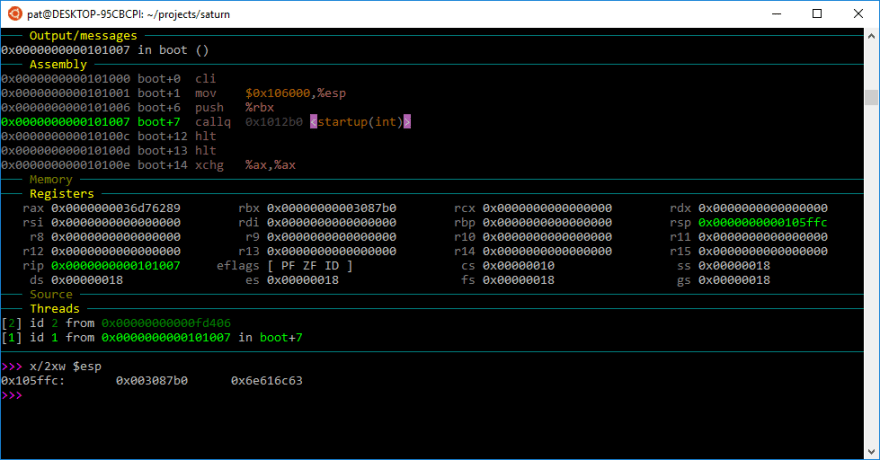
EBX (but it's called RBX... hint for later) is 0x3087b0, and we can see it at the top of the stack as well. Now let's step inside startup...
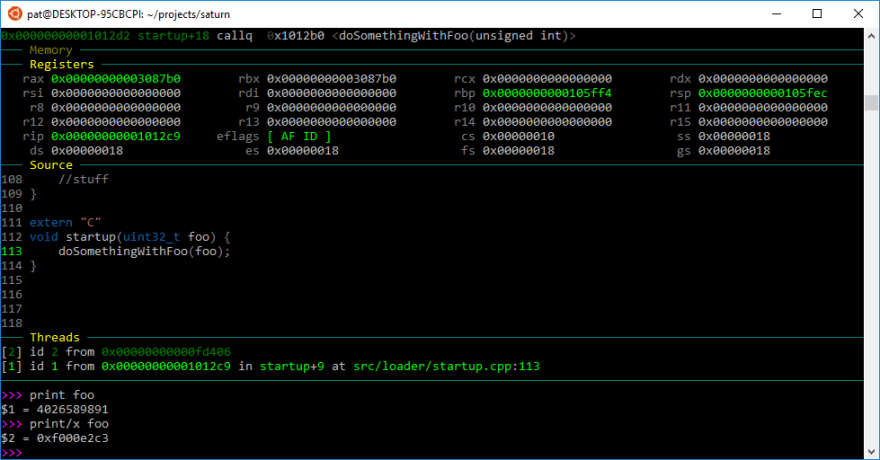
Ooh... yeah, uhm I'm gonna have to go ahead and sort of disagree with you there.
Something's very wrong here, a few instructions (four to be exact) ago we had one value, a few instructions later we have a completely different value. The four instructions aren't the culprit, its just the standard function prologue. And why was GDB showing us x86_64 registers?
Use the (other) force, Luke!
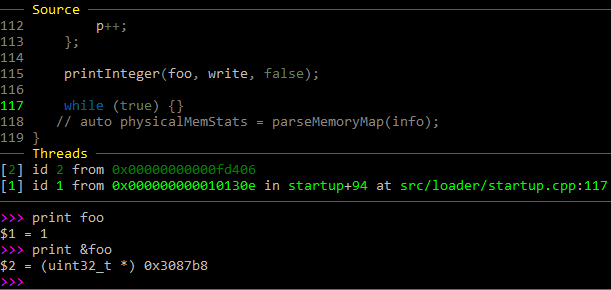
With GDB acting weird I decided to try the classic printf debugging. Well, print-to-VGA-buffer-f, since printf itself hasn't been built yet. At any rate, the function has been tested and been known to be correct; whatever it prints on the screen is the real value of foo. Survey says...
3087B0
Well now, that's what I was expecting. While we're here, let's ask what GDB thinks of foo after printing it to the screen for fun:
GDB, how can I put it nicely...

Unearthing the conspiracy
The story gets worse my friends. Through countless minutes of googling and some friends in #osdev, I've found that both QEMU and GDB have conspired to make mixed-mode debugging infeasible. Some time between versions 2.8 and 2.9 QEMU added a certain patch so that no matter what mode the cpu is currently running (real, protected, long), it will always send the full x86_64 register file through the GDB stub. GDB was patched to never change its register file size after startup. So when first connecting gdb to a x86_64 QEMU instance GDB sees that QEMU sends a full x86_64 register file and just goes with it, even though CPUs don't start in long mode (but to be fair it doesn't know it's debugging an OS at bootup).
Meanwhile GDB thinks since we're using the 64-bit RF that it should use x86_64 bit calling convention. At least that's what I'm assuming based on my observations. System V i386 ABI says that we pass parameters by pushing them on the stack, which I did right before calling the startup function. But SYS-V x86_64 ABI says that the first couple of parameters are passed in registers rdi, rsi, rdx, rcx, r8, r9 and then any extras are pushed on the stack. So when asking GDB for foo's value its looking in the wrong place, hence the junk value.
We can make a test for this. Inside boot.s right before the call instruction, we can set EDI to some value like 0xcafebabe. Guess what value GDB now says foo is?
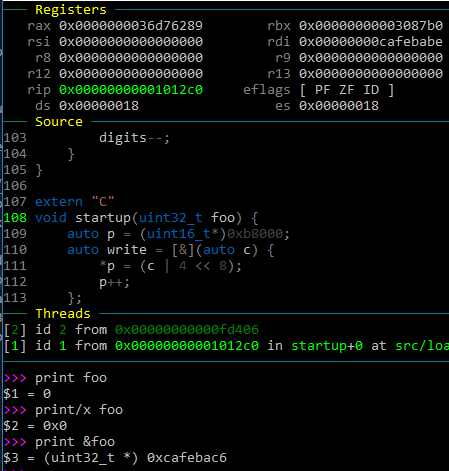
The value is 0, the address is Cafebac6. I have no explanation for why it's offset by 8, if you do please let me know. The final nail in the coffin is to try with qemu-system-i386 instead of system-x86_64, without making a single code change. To no one's surprise, GDB prints the correct value for foo.
Now its important to note here that QEMU is still emulating the program correctly. Even though we can't see it in GDB, the program gets the correct value and can display it. The problem is just how GDB views the state of the program. And it's only a problem for people that want to debug the startup code of an operating system which you would rarely do even if making your own OS, and only when the startup code isn't 64-bit and your emulator's CPU is.
This affects dozens of us. DOZENS!
Summary
When something doesn't look right and your debugger appears to give you incorrect results, fall back on the other tools in your debugging toolbox. Good old reliable printf or logging, rendering an image of an intermediary or data buffer to the screen for GPU problems. Or create some test that modifies the environment in a unique way that demonstrate whether something did or did not happen. Examples include sleeping a thread for X seconds to determine whether X is small or big, blinking a light, emitting morse code through the speakers etc.
If you have any questions or comments, corrections or suggestions, criticisms et cetera, I’d love to get in touch by email or in the comments below. I’m always open to learning new things and correcting bad things. If you'd like to read more posts by me, why not come check out my blog.


Latest comments (0)