Tekrar merhaba, bu aralar "The Expanse" adlı diziyi izledik. (6 sezon). Henüz hala etkisinden kurtulamamışken ilk dashboard'u The Expanse ile ilgili verileri kullanarak yapmaya karar verdim.
Öncelikle portfolio için Layout oluşturacağım. Layout içerisinde konularına göre ayrılmış bir Sidebar olacak. Belki sonradan Footer ve Header da ekleriz ama şimdilik gerek yok.
Sidebar.tsx:
import type { NextPage } from 'next'

const SideBar: NextPage = () => {
  return (
    <div className="w-72 bg-black text-white h-screen">
      Sidebar
    </div>
  )
}

export default SideBar
Layout.tsx:
import Sidebar from "./Sidebar";
import Head from "next/head";
import React from "react";

type Props = {
  children: React.ReactNode
}

const Layout: React.FC<Props> = ({ children }) => {
  return (
    <div className="flex">
      <Head>
        <title>Create Next App</title>
        <meta name="description" content="Generated by create next app" />
        <link rel="icon" href="/favicon.ico" />
      </Head>
      <Sidebar/>
      <main>{children}</main>
    </div>
  )
}
Bunun için, pages klasörü altında "the-expanse" adında yeni bir sayfa oluşturuyorum ve Layout içine ilk grafiğimi oluşturacağım.
import type { NextPage } from 'next'
import Layout from "../components/Layout"

const TheExpansePage: NextPage = () => {
  return (
    <Layout>
    </Layout>
  )
}

export default TheExpansePage
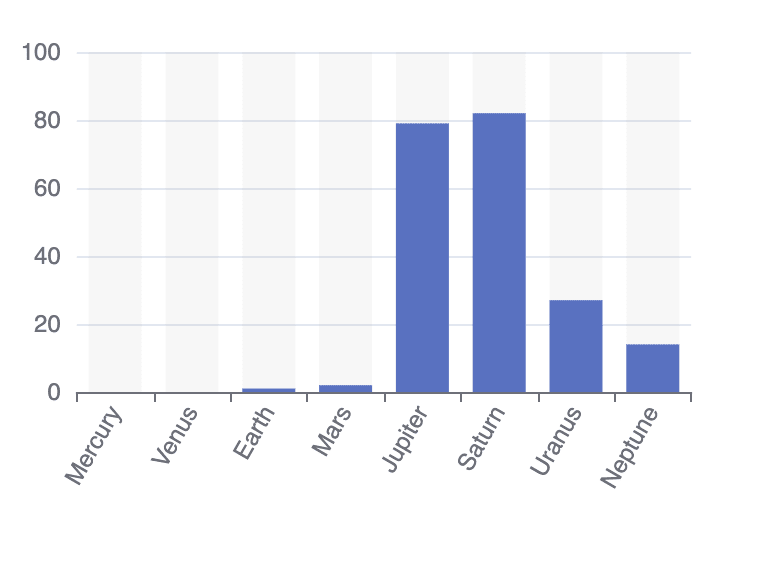
İlk grafiğim en basitinden bir çubuk grafik (bar chart) olacak ve Güneş sistemindeki gezegenlerin uydu sayılarını gösterecek.
İl önce ReactEcharts'ı ekliyoruz ve option adında bir değişken tanımlıyoruz. Değişkenimiz bir grafik oluşturmak için en az x ve y eksinindeki değerleri ve grafiğin tipini içermelidir.
import React from "react";
import ReactEcharts from "echarts-for-react";
import type { NextPage } from 'next'

const Orbit: NextPage = () => {
  const option = {
    xAxis: {
      type: 'category',
      data: [ 'Mercury','Venus','Earth', 'Mars','Jupiter', 'Saturn','Uranus', 'Neptune'],
    },
    yAxis: {
      type: 'value'
    },
    series: [
      {
        data: [0,0,1,2,79,82,27,14],
        type: 'bar',
      }
    ]
  };
  return (
    <div className="w-96 h-96">
      <ReactEcharts option={option} />
    </div>

  )
}
export default Orbit;
the-expanse.tsx sayfasına Orbit bileşenimizi(component) ekledikten sonra ilk grafiğimizi oluşturmuş oluyoruz.
import type { NextPage } from 'next'
import Layout from "../components/Layout"
import Orbit from "../components/charts/Orbit";

const TheExpansePage: NextPage = () => {
  return (
    <Layout>
      <Orbit/>
    </Layout>
  )
}

export default TheExpansePage

Grafiğimizde bazı gezegen isimleri görünmüyor. Bunun için x ekseninde bulunan isimleri açılı gösterebiliriz.
      axisLabel: {
        rotate: 60
      },

Sadece veri serisini verdik ve grafik veri setimize göre auto scale edildi. Yani veri 0-82 aralığındaydı ve grafiğim 0-100 aralığında oluştu.
Verinin daha rahat algılanabilmesi için arka planı renklendirebiliriz.
Grafiğe başlık eklemek için:
    title: {
      text: 'Number of Moons'
    },
Üzerine geldiğimizde uydu sayısını göstermesini istersek (tooltip): option değişkenine tooltip özelliğini eklememiz yeterli.
tooltip: {},
Grafik çubuklarının rengini değiştirmek için de color özelliği eklememiz yeterli.
Son durumu:

import React from "react";
import ReactEcharts from "echarts-for-react";
import type { NextPage } from 'next'

const Orbit: NextPage = () => {
  const option = {
    title: {
      text: 'Number of Moons'
    },
    tooltip: {},
    color: '#60a4b3',
    xAxis: {
      type: 'category',
      data: [ 'Mercury','Venus','Earth', 'Mars','Jupiter', 'Saturn','Uranus', 'Neptune'],
      axisLabel: {
        rotate: 60
      },
    },
    yAxis: {
      type: 'value'
    },
    series: [
      {
        data: [0,0,1,2,79,82,27,14],
        type: 'bar',
        showBackground: true,
        backgroundStyle: {
          color: 'rgba(180, 180, 180, 0.1)'
        }
      }
    ]
  };
  return (
    <div className="w-96 h-96">
      <ReactEcharts option={option} />
    </div>

  )
}
export default Orbit;


Top comments (0)