
In this article, I explain how I tested a few cloud service providers for their file delivery speed in order to select one to use at my company. Specifically, I measured the time it took for their object storage to return enough of a file for a test application to use. (Also, this is my first post here on Dev (and in life) so feedback not only the test methods, but on the writing itself is welcome.)
First a little bit of context. Feel free to skip this part
The startup I work at provides its services through an app, and high-quality video plays a key role on how we deliver value to our users. Since development speed is fundamental and re$ources are scarce we had chosen a one-size-fits-all managed backend as our "infrastructure".
Boy were we in for a treat.
This week, as we got ready to release our service to the public, our backend provider decided limit individual files size do 15 MB. 15 MB! Do you know how many seconds of 1080p@60fps video fit in 15 MB? Answer: Not many.
But that's a rant for another time. We're running against the clock here. Let's get on with the testing.
0. Meet the contestants
- Digital Ocean Spaces + their standard CDN
- Amazon S3 + Cloudfront CDN
- Google Cloud Storage (has a CDN by default)
- Our current provider (using the link they provide us with when upload is completed)
1. Testing environment
All services were configured in their fastest default setting (when available) selecting the datacenter closest to where most of our users are (extremely southern Brazil). This means:
- NYC 3 for Digital Ocean
- America/São Paulo for Amazon S3
- southamerica-east1 (São Paulo) for Google Cloud Storage
- Northwestern US (according to an IP tracker) for our current provider
In order to simulate as closely as we could the usage scenario while still providing an isonomic environment for our contestants, the same file (a m4v video) was uploaded to each server and a test app was written in Swift.
To reduce influence from external factors, the test device was connected to a 150 Mbps dedicated link.
2. Testing procedures
All the testing should be done autonomously. So after starting up, the test app would
- Start a timer;
- attempt to load the video from one of the services;
- play the first frame of the video;
- stop the timer or;
- timeout after 2 seconds;
- repeat from process number 2 on the next service.
After 100 passes through all 4 services it would stop.
The lowest 90% of the "time to first frame" for each candidate would then be averaged to give us our winner.
Disclaimer: I'm no expert in statistics. But, from what I've researched, it seems a sample size of 90 seems to be enough to catch on a difference of 0.25 seconds in load time.
3. Implementation
To keep the test app as simple as possible, but still resembling the use case in our production app, we are going to execute the tests on top of the same frameworks used in the latter: AVFoundation and UIKit.
The code for the app is available here.
I didn't bother to make the app capable of exporting the test results. Instead, the values are CSV encoded and printed on the console.
4. Results
The test ran smoothly and was completed in about 10 minutes. Each attempt had a hard 3-second time limit to succeed, so the test could last at most 3*4*100/60 = 20 minutes.
Across all 400 loads that limit was only hit once by a single provider (Digital Ocean). But since we're only considering the top 90% loads that datapoint was discarded.
After analysing the test data in Numbers, results seem to be clear. Figure 1 shows the average "time to first frame" (in seconds) for each provider:
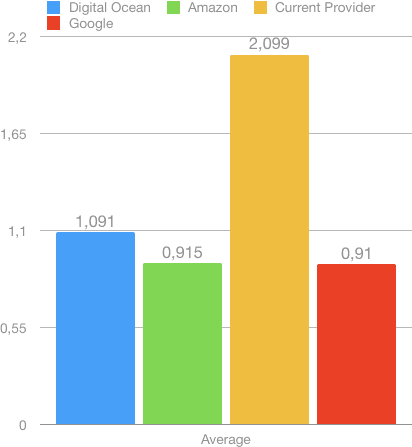
The 3 alternatives to our current provider delivered consistently better results and even the slowest (on average) contestant was over 50% faster on half of the loads.
To their merit, our provider delivers data in a considerably more predictable time, which in some cases can be desirable. Figure 2 shows the standard deviation for each service:

The higher standard deviation found in Digital Ocean seems to be caused by some routing phenomena. They also had a big warning message on their site about some ongoing maintenance in another datacenter, which could explain these results, but that's all just speculation.
5. Further work
This test only considered the "time to first frame" for a single file of under 15 MB (a 720p video). More investigation should be done with incrementally larger files (higher video quality and longer duration) and in poorer network conditions. The test app could also be improved to allow selecting the sample size before testing (it's hardcoded right now). Other tests could also play the video for a longer time to check for playback interruption.
6. Conclusions
It seems our clients would be wasting a lot of time waiting for their videos to load had we not investigated this matter. For now we will keep our database and business logic the way they are in our current provider.
It would be unwise (to put it mildly) and too costly to migrate everything on our launch week. Luckily our videos won't change that much and can be managed by hand for now, so we will just migrate them to the provider we chose.
All 3 alternatives had performance similar enough that other factors – such as cost and usability – could be considered when choosing where to move our files. For now, we're leaning towards Google Cloud Storage but a few more tests are necessary.
I tried to keep this article concise yet bring enough information for other people be able to reproduce the tests on their own setting. Is there anything you would've done differently? Do you make this kind of measurements often? I'd really appreciate your input. Thank you for reading through all this.
Cover photo by Veri Ivanova on Unsplash


Top comments (0)