
In the digital age, data visualisation is crucial for understanding complex datasets. Visual Heatmap, an open-source JavaScript module, emerges as a powerful tool designed to render large-scale heatmaps with exceptional performance. This article delves into the functionality of Visual Heatmap and explores how it's revolutionising the way we visualise data.
Github: https://github.com/nswamy14/visual-heatmap
What is a Heatmap?
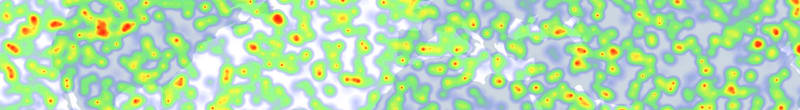
A heatmap is a graphical representation of data where individual values are denoted by colors. Often used to show variation across a two-dimensional surface, heatmaps make it easy to understand complex data at a glance. They are particularly useful in various fields, from geographic mapping of demographics to displaying website traffic density.

High-Performance Visualisation with Visual Heatmap
Visual Heatmap stands out due to its ability to handle and render over 500,000 data points seamlessly. By leveraging cutting-edge WebGL/Shaders for graphical rendering, it ensures that even the most extensive datasets are displayed smoothly and interactively.
Key Features and Advantages:
- High-Performance Rendering: Effortlessly manage and render vast datasets with high responsiveness.
- Scalability: Capable of visualizing over 500,000 data points, making it ideal for large-scale applications.
- Easy-to-Use Syntax: The module's syntax is intuitive, making it accessible even to those new to coding.
- Lightweight Framework: Despite its robust capabilities, Visual Heatmap is lightweight and won't bog down your applications.
- Customisable: With a range of API options, users can tailor the heatmap to fit their specific needs, from adjusting point intensity and size to setting custom color gradients.
Installation and Setup
Installing Visual Heatmap is straightforward. Users can add it to their projects via npm with
npm i visual-heatmap --save
Or Download source code from below GitHub repo
https://github.com/nswamy14/visual-heatmap
Demo:
Click on the below examples


Crafting Your Heatmap
Creating a heatmap is simplified with a primary method, Heatmap(containerId/containerElement, config). This function initiates a new WebGL heatmap layer and returns a render instance for further manipulation. The configuration options are extensive, allowing for detailed customization, including size, maximum data value, blur, opacity, and more.
let renderInstance = Heatmap('#containerId', {
        size: 30.0,
        max: 100,  // if not set, will be derived from data
        min: 0,  // if not set, will be derived from data
        intensity: 1.0,
        background: {
            url: "urlPath",
            width: 100, // if not set, viewport width of the image will be considered
            height: 100, // if not set, viewport height of the image will be considered
            x: 0,
            y: 0
        },
        gradient: [{
            color: [0, 0, 255, 1.0],
            offset: 0
        }, {
            color: [0, 0, 255, 1.0],
            offset: 0.2
        }, {
            color: [0, 255, 0, 1.0],
            offset: 0.45
        }, {
            color: [255, 255, 0, 1.0],
            offset: 0.85
        }, {
            color: [255, 0, 0, 1.0],
            offset: 1.0
        }]
    });
Interactive and Dynamic
Once instantiated, Visual Heatmap provides several API methods for dynamic interaction. Users can render data, add new data points, adjust maximum values, and apply transformations such as zoom, rotation, and translation. This interactivity ensures that the heatmap is not just a static image but a dynamic visualisation tool.
instance.renderData([])
Accepts an array of data points with 'x', 'y' and 'value'.
instance.addData([], transformationIntactflag);
Accepts an array of data points with 'x', 'y' and 'value' and a flag to specify to apply existing canvas transformations on the newly added data points.
instance.setMax(number)
To set max data value, for relative gradient calculations.
instance.setMin(number)
To set min data value, for relative gradient calculations.
instance.setTranslate([number, number])
Method to perform translate transformation on the canvas. Accepts array[x, y] as an input.
instance.setZoom(number)
Method to perform zoom transformation on the canvas. Accepts float value as an input.
instance.setRotationAngle(number)
Method to perform rotation transformation on the canvas. Accepts angle in radians.
instance.setSize(number)
Method to set point radius. Accepts float value as an input.
instance.setIntensity(number)
Method to set Intensity factor. Accepts float value as an input.
instance.setOpacity(number)
Method to set Opacity factor. Accepts float value as an input.
instance.setBackgroundImage({ url: , x: , y: , height: , width: })
Method to set Background image. Accepts Object with { Url, height, width, x, and y} properties as input.
instance.projection({x: , y: })
Api to get projected co-ordinates relative to the heatmap layer.
instance.clear()
Method to clear canvas.


Top comments (0)