
Synthetic monitoring, or active monitoring, is the practice of using software to run tests which simulate agent requests, monitoring the results, and providing data so teams can draw insight, identify issues, resolve problems, and make improvements. This enables teams to understand how different inputs impact user experience and head off any problems before they impact usability.
Sometimes it may be possible—and in some cases, preferable—to monitor the usability of an application via human interaction. However, 24x365 availability requires around-the-clock examination, which is generally best left to automated tools that mimic user activity synthetically.
An eager administrator may be tempted to accomplish synthetic monitoring by “gluing” custom scripts together. While such an approach can create adequate coverage for unique scenarios encountered by each platform, edge cases make it difficult to create exhaustive coverage. Furthermore, scripts created to test services built on complex underlying stacks of technology tend to be anywhere from “high maintenance” to “fragile,” due to changes in underlying technologies. Such changes may have an adverse or otherwise unanticipated effect on the application, requiring a manual update to the testing apparatus. As a result, synthetic monitoring tools have come to the fore in websites that require high availability and performance.
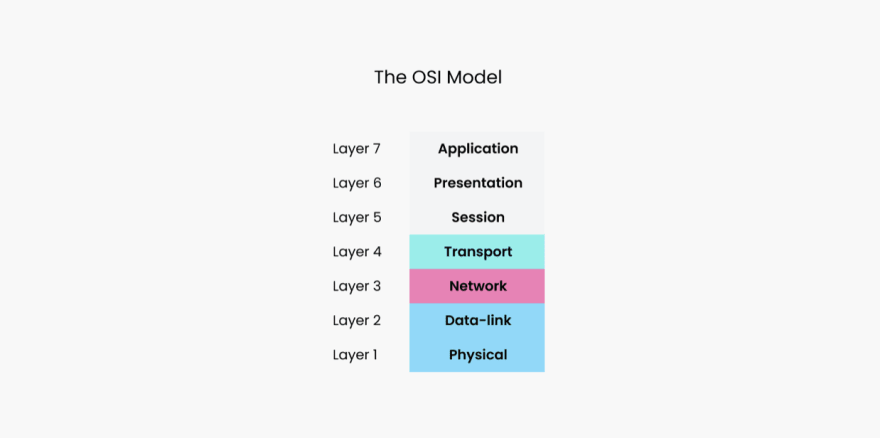
We can view the performance of synthetic testing in the context of the OSI model. In this model, each layer is implemented based on services provided by the layers beneath it. This means that to test a protocol at the Application layer effectively, we assume that proper functionality has been implemented by other protocols in the remaining six layers (Physical, Data Link, Network, Transport, Session, and Presentation).
IP/HTTP monitoring
First, let’s look at IP/HTTP monitoring, an area that is pretty critical. Why? If your site is not available to users, all other facets of monitoring become irrelevant.
Utilizing synthetic monitoring tools to identify and resolve accessibility issues helps you achieve four nines (99.99%) uptime. This means an average of about one hour of downtime per year.
| Availability | Downtime per Year |
|---|---|
| 99.8% | 17.52 hours |
| 99.9% (“three nines”) | 8.76 hours |
| 99.95% | 4.38 hours |
| 99.99% (“four nines”) | 52.56 minutes |
| 99.999% (“five nines”) | 5.26 minutes |
| 99.9999% (“six nines”) | 31.5 seconds |
| 99.99999% (“seven nines”) | 3.15 seconds |
Application availability translated into downtime per year.
HTTP is an Application Layer protocol, so you can test for connectivity there. However, the HTTP protocol works over IP and TCP, so it may be a good idea to start testing at the Network and Transport layers before testing HTTP communication.
Using a simple tool such as ping would be sufficient to ensure that your host is reachable and packets can be delivered from the outside world. Ping times provide a close approximation of the state of the network with no dependence on the state of the service. Of course, this type of testing can be integrated with other similar tools, such as traceroute, to determine where traffic fails.
There are a few problems with attempting to continuously monitor using such tools. First, there is the high volume of network traffic generated by their continuous use. Additionally, there is often a manual effort required to interpret their output. For this reason, a synthetic monitoring tool that can periodically check for this connectivity (say, every 5-10 seconds) is desirable.
Another advantage of synthetic monitoring tools is that they can recover from failure as opposed to shutting down upon the first loss of connectivity. Hence, a temporary network disruption can simply be logged while monitoring continues. Threshold configuration can be advantageous here, since applications can ignore packet loss up to a certain level before triggering an alert.
Service monitoring
Next, let’s look at service monitoring.
Monitoring process identification numbers (PIDs) manually at the OS level can allow an administrator to restart an application or service immediately upon failure. However, several problems could arise (aside from the PID not existing), so you need to use a more comprehensive approach.
Monitoring traffic volume from the web server is also a viable option. However, high bandwidth alone will not guarantee that a service is functioning properly. For instance, returning multiple error messages and large stack traces can potentially generate sufficient bandwidth to make a site appear to be “up.”
A more encompassing approach checks for a status code from your application (such as the 200 code returned as “OK” from an HTTP request) among known “good” responses. A synthetic monitoring tool may be useful here due to its capacity for comprehensive logging and configurable alert levels, depending on the response received.
Transaction monitoring
Understanding that many pages will contain non-static content (e.g., eCommerce or social media pages), consider how different services within a domain interact with each other. For instance, a single use case may involve calls to multiple APIs and, possibly, require several database queries to execute. Hence, you need a tool that allows you to test multi-step “transactions.”
As mentioned above, you can create and “glue” multiple shell scripts together and provide them with static data to mimic a transaction. However, determining where a process broke or why can get pretty messy. This is where synthetic monitoring comes in handy.
The ability to monitor transactions step by step (e.g., browsing a product catalog, shopping cart, checkout, etc.) is invaluable. Synthetic monitoring allows you to view, query, and manipulate inputs for each step transaction.
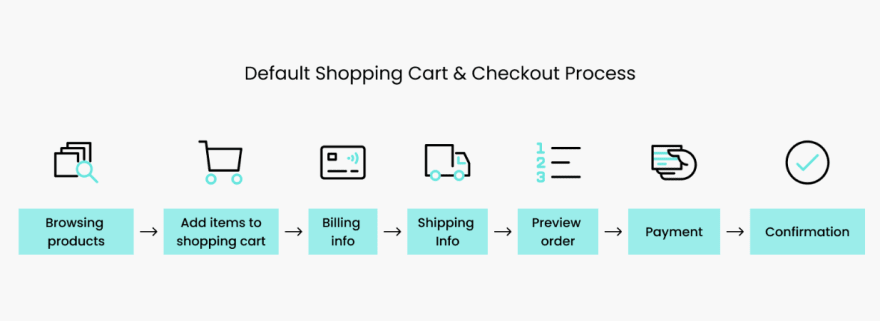
A typical e-commerce checkout process. Source
Performance monitoring
Now that you understand IP/HTTP monitoring and service monitoring, let's take a look at performance monitoring. Performance monitoring involves measuring the availability of a network by the speed at which data travels across it. Most commercial web providers offer service response times in the 500-1000 ms range, while the best of these offer 200-300 ms response times. A synthetic monitoring tool can alert the web administrator when this number begins to deviate and help pinpoint what events coincided with the latency (e.g., maintenance or an ad-hoc process).
While an application may perform as expected with only one user or a few users logged in, performance could quickly degrade or become erratic when the system is placed under sufficient load. This may be caused by many factors, such as insufficient bandwidth, hardware that cannot support the active number of users, or perhaps slow database functionality. Therefore, it is highly advantageous to use synthetic monitoring to test for both speed and correctness under heavy load.
Furthermore, indicators that are less transparent to the user, such as queue length and hit rate, may be monitored on the back end to identify potential bottlenecks before they impact performance. To accomplish this manually would require an administrator to write and then invoke several instances of test scenarios in tandem in quantities sufficient to mimic heavy user traffic. Using a thread-based synthetic monitoring tool, however, greatly simplifies the process because invoking the load of one or many users is almost identical and can quickly be configured internally.
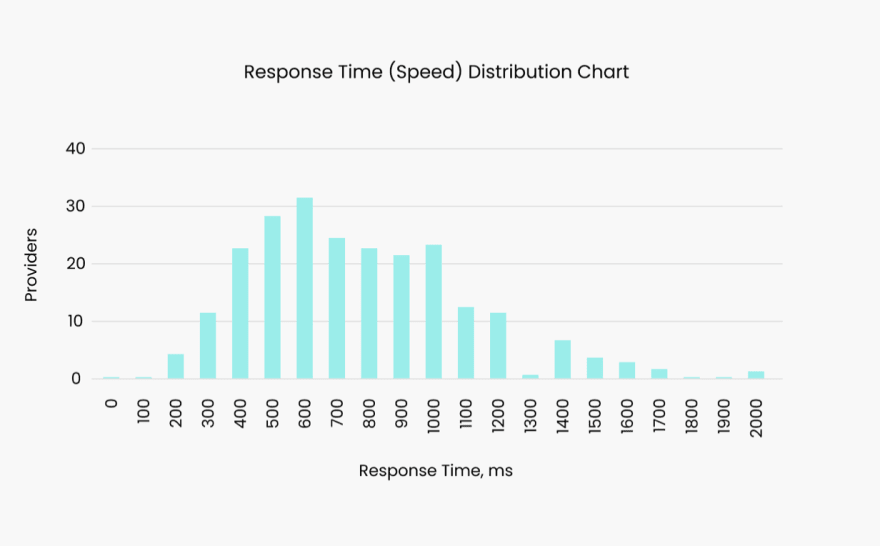
Distribution of average response times by provider. Source.
Logging and resource monitoring
Logging is also an enhanced benefit of synthetic monitoring. While more bare-bones approaches may have worked in the past, such as echoing data to log files, they have proven to be tedious to observe, maintain, and analyze. Synthetic monitoring tools help aggregate this data and and display trends visually, before they become a problem.
Additionally, synthetic monitoring can be very helpful for monitoring external resources (i.e., third-party data sources) upon which your site may rely. If not monitored, unexpected timeouts may occur that are outside your website’s control.
Conclusion
Used in tandem, customized scripting along with synthetic monitoring tools make four nines availability more easily achievable. Selecting the right synthetic monitoring tool can streamline the process of site monitoring and save a lot of frustration.
While we’ve discussed several important aspects of synthetic monitoring to consider during your tool search, we have not explored a comprehensive list. Review this article for additional important selection criteria and this free multi-chapter educational guide to explore the topic of synthetic monitoring in more depth.
Testing a web-based application can be difficult and requires an extensive set of tools to ensure that potential problems are adequately addressed. While some manual scripting may be beneficial for such a task, tools such as synthetic monitors are invaluable to a system administrator. As web technology stacks grow and change, synthetic monitoring tools shine, because they do not require code to be rewritten and updated upon each change in the underlying technology stack.

Top comments (0)