| Diving deeper beyond the surface of microservice interactions
Think back to the last time you checked the tracking information for a package you were expecting to receive. You might have followed a link in your email that gave you a breakdown of where and when your package was received and shipped out of various locations. You could make a mental map of what shipping facilities passed through around the world it and how long it spent there and on the road.
From that information, you probably got a sense of what kind of journey your package took and why it took as long as it did to get to your doorstep.
We can take this principle of tracking the path of a package across various stops and apply it to the flow of information between software systems.
In the current paradigm of distributed microservices, where a simple request to load a webpage might bounce between a dozen different applications, it becomes valuable to observe or trace the path of data requests across applications and networks.
Client-Server Example
I like to bring the concept of opentracing down to the level of two applications in a client-server model. We can take the concepts here and expand on them to apply to any number of applications orchestrated together.
Say, for example, we have a simple web server application that receives a request at the endpoint /hello and sends back a static string of text "hello" back to the client.

From the perspective of the client, they send a request, wait some time for things like the network between itself and the server as well as time for the server to process the request. Within the server, there is only a single action that occurs, within the context of the same application. We can visualize this entire transaction in a "span". This span has a begin and ending time as well as some detail or "tag" about the type of operation being performed.

Now the client knows about the request and response, including what was sent, when it was sent, what was received back, and when it was received back. The server knows something similar but from its own perspective of when a request was received and responded to.
The missing piece here is that without us drawing out the scenario or manually associating these events between the two applications, there's no easy way to link them together and gain insights about this interaction.
Tracing Requests
In order to start creating a complete picture of the interaction between these two applications, we need an outside "observer" to gather information about the client and server interactions. That observer can then look at the interactions holistically and gain better insights by looking at the complete picture.
In this example, let's say that the client and server know about this observer and report every time they send or receive data. They will tell the observer about every relevant event in the exchange with the following information:
Who they are
Who they're interacting with
If they're sending or receiving data
What data they're sending or receiving
A timestamp when that event occurred
The interaction might follow as illustrated below:

Here's the breakdown of actions that the Observer is recording:
- Client sends a /hello request to Server at time0
- Server receives /hello request from Client at time1
- Server processes request and responds to Client with "hello" at time2
- Client receives "hello" from Server at time3
The observer is now able to correspond to the events of this two-party interaction as a contiguous group of information. Here are now some interesting insights we can gain from this simple integration between just two systems:
Where was the most latency happening? Maybe it was in the network between the client and server, or maybe the server processing time.
If the request failed, did it ever make it to the server or was it lost in the link between it and the client?
We can even take it a step further and break the processing in the Server into multiple steps and report those to the Observer as well.
- Client sends a /hello request to Server at time0
- Server receives /hello request from Client at time1 2.a. Server parses the request from the Client at time1a 2.b. Server runs the buildResponse() function to provide the appropriate response to the requester at time1b
- Server responds to Client with "hello" at time2
- Client receives "hello" from Server at time3
Now we can go even deeper and see how long certain processes are taking on the server or even exactly which process might have failed during an exchange.
Spans and Traces
Let's take the above example of information that the Observer is recording and add two more pieces of information:
- A Span ID that an application generates every time it reports an event
- A Trace ID that each application will pass along if the data it receives contains it. If not available, a new one will be generated and reported.
If the applications attach this metadata to the events they're sending to the Observer, now the data the Observer records will look something like this:
- Client sends a /hello request to Server at time0 (TraceID: hellorequest1, SpanID: 1)
- Server receives /hello request from Client at time1 (TraceID: hellorequest1, SpanID: 2) 2.a. Server parses the request from the Client at time1a (TraceID: hellorequest1, SpanID: 3) 2.b. Server runs the buildResponse() function to provide the appropriate response to the requester at time1b (TraceID: hellorequest1, SpanID: 4)
- Server responds to Client with "hello" at time2 (TraceID: hellorequest1, SpanID: 5)
- Client receives "hello" from Server at time3 (TraceID: hellorequest1, SpanID: 6)
The Observer can now use the Trace ID to group these series of events together and break it down into its individual parts using the Span IDs.
Since this will probably clutter up the component diagram, this information can be summarized as a series of spans in time. Note the functions on the client to process the response are omitted, but you can surmise what the spans for those might look like:

The Span ID "hellorequest1" covers all the spans below it and logically groups the tracing information of the events happening within it like the client sending the request, the server receiving it, and the server processing to send the response back to the client.
The Client generates a Trace ID when it initiates the interaction. From then on, each participant in the exchange knows to pass on the Trace ID if it is present. Each participant also know to generate a new Span ID every time data is moved from one logical context or operation to the next. Every event is reported to the Observer along with these IDs. In that way, each complete transaction can be logically grouped but also deconstructed into its individual pieces once assembled at the Observer.
Tracing Multiple Applications
Let's take our example with two applications and extend it to four applications.
Let's say the exchange still starts with our Client application, but this time it's sending a /readinfo request to the Server. The Server can't process this request by itself, so it sends a request each to two other applications, let's call them the SecurityService and InfoService. When Server receives a /readinfo request, it has to first ask the SecurityService if the requester has the right permissions to read this info. If that is successful, it then calls the InfoService to pull the info, and finally sends it back to the requester.
Let's draw this interaction out. We can label the order in which the operations happen and we can then infer the series of events being recorded by the Observer.

Here's what the Observer recorded based on the events each application sent it. All the events are listed with the numbers from the diagram matching the numbers on the list. I'm omitting timestamps and ID's to save some space, but you can fill in the blanks:
- Client sends a /readinfo request to Server
- Server receives a /readinfo request
- Server sends an /access request to SecurityService
- SecurityService receives an /access request
- SecurityService responds to the /access request
- Server receives the /access response from SecurityService
- Server sends an /info request to InfoService
- InfoService receives an /info request
- InfoService responds to the /info request
- Server receives the /info response from InfoService
- Server responds to the /readinfo request from Client
- Client receives the /readinfo response
Just by adding two players into the mix, the number of events being recorded has grown quite a bit. We can visualize the same list of events as spans to provide a better view of the execution path of the /readinfo request:

Notice all the events are still grouped in the same TraceID, but we can see the span of each individual service passing the request between each other and working together to process the final result to the Client.
We could extend the granularity of the spans further by including details about functions and subroutines running within each application.
Out of the Example and Into the Real World
The above concepts are simplified versions of terms and constructs formalized in the Opentracing Specification for microservices and distributed applications.
There are many opensource libraries and software that implement the Opentracing specification. You can integrate these into your own applications to gain powerful insights into the interactions of your microservices.
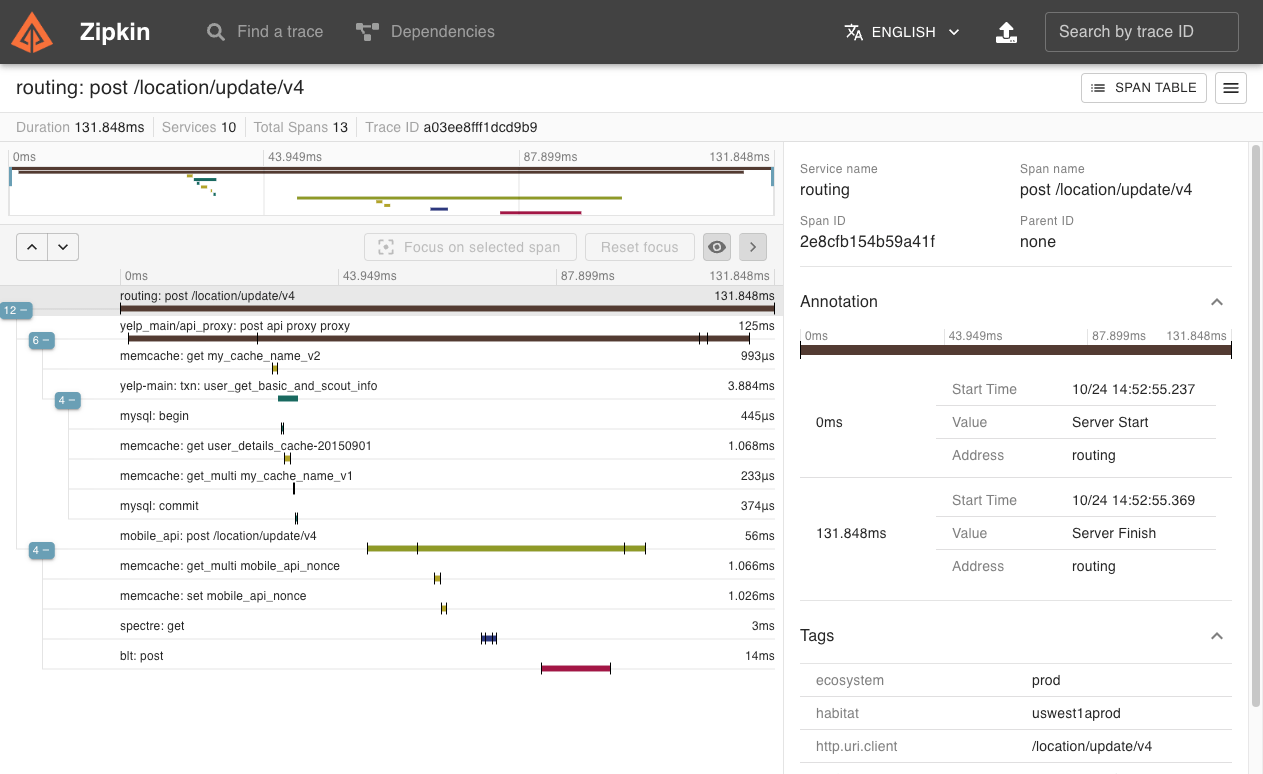
Once your application can communicate via Opentracing, you still need an Observer to record all the events being emitted from the applications. There are many systems that implementing the Opentracing spec. Zipkin is one of these popular distributed tracing systems that you can install and run yourself. It plays the part of the Observer from our examples and consumes tracing data from applications that adhere to the Opentracing standard to provide interactive visuals of your application traces.

Source: https://zipkin.io/public/img/web-screenshot.png
If you're like more information about Opentracing, you can check out their website which has specification docs as well as guides to get started with Opentracing.
You can also play around with zipkin which has library support for pretty much any programming language you're probably thinking of using.
Let me know your thoughts about this article or Opentracing in general here or over on Twitter.


Top comments (0)