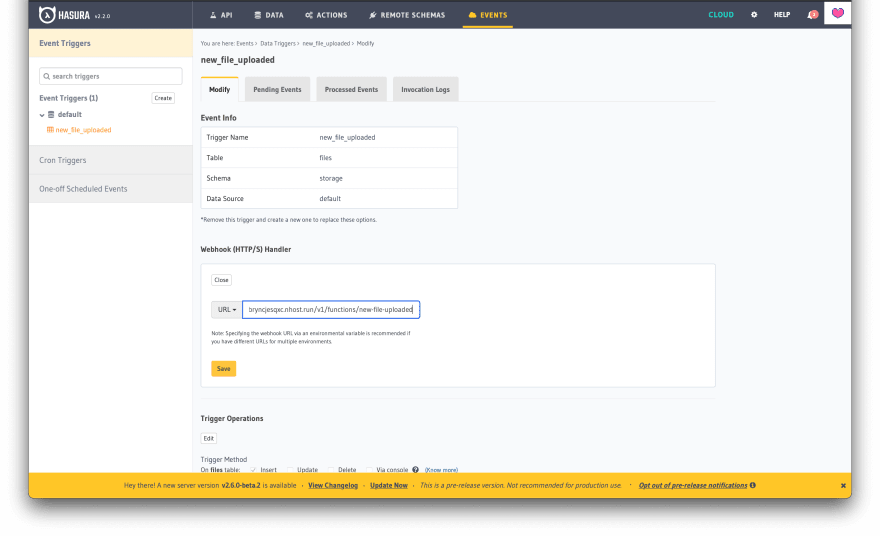
Hasura Storage is an open source service that bridges any S3-compatible cloud storage service with Hasura and it is the service we, at Nhost, use to provide storage capabilities to our users.
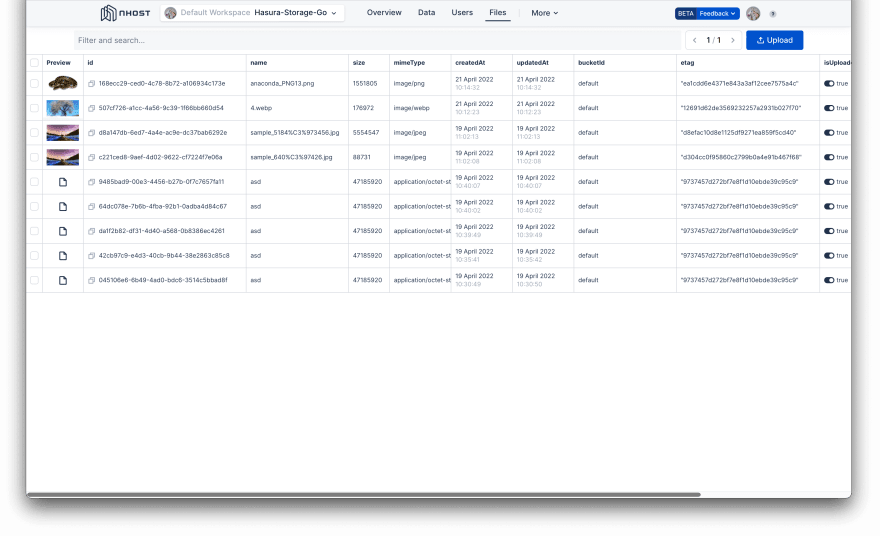
Its objective is to allow users to combine the features they love about Hasura (permissions, events, actions, presets, etc.) with the convenience of being able to show files online.


The service, written in Node.js, has served us well for quite some time but as the company grew and the number of users increased performance at scale started being a concern, while Node.js may be great for many reasons, performance and scalability aren't one of them.
For those short on time, the goal of this blog post is to showcase the gains we incurred across all metrics by rewriting a Node.js microservice in Golang. Gains that include a 5x increase in the number of requests served while halving memory consumption.
Deciding to rewrite the service
As the need to scale became more important we decided to rewrite the service in go. The reasons behind Golang were many:
- Its dependency management system and build system make it a perfect fit for the cloud
- Nhost team had plenty of experience with Golang
- Even though it is a very verbose language, especially compared to Node.js, it is very easy to learn and fast to write
- It is known to be very performant
If you are interested in learning more about the language and its promises ACM has a good article about it.
Rewriting the service
The actual rewrite was quite uneventful. Writing microservices like this is a well-known problem and, while the service is very useful and convenient, it doesn't perform anything too complex. Hasura-storage's innovation and usefulness come from bridging two great services that our users love; s3 and Hasura, not from doing anything whimsical.
Benchmarking the service
When the rewrite was completed we decided to run some benchmarks against both the Node.js and Golang versions of the service. To do so we used k6 and designed the following test:
- When a test starts it ramps up its number of workers from 1 to TARGET during the first 10 seconds
- Then it runs for 60 seconds more before winding down.
- Workers query the service as fast as possible
- We run the following tests:
-
download_small_file(100 workers) - Download a 100KB file -
download_medium_file(100 workers) - Download a 5MB file -
download_large_file(50 workers) - Download a 45 MB file -
download_image(100 workers) - Download a 5.3 MB image -
download_image_manipulated(10 workers) - Download the same image but resize the image and apply some blur on the fly
-
- CPU was limited to 10% of the overall system
- RAM was unlimited
Before seeing the conclusions I want to clarify the numbers we are going to see shouldn't be taken at face value, the system used for the benchmark had its CPU allowance quite limited as we wanted to stress both services and see how they behaved under pressure so, what we are interested in isn't the raw numbers, but the difference between the two versions.
Number of requests
We are going to start by looking at the number of requests as this is the main metric that will dictate if the other metrics make sense or not (i.e. decreasing RAM while serving fewer requests might not be something desirable).
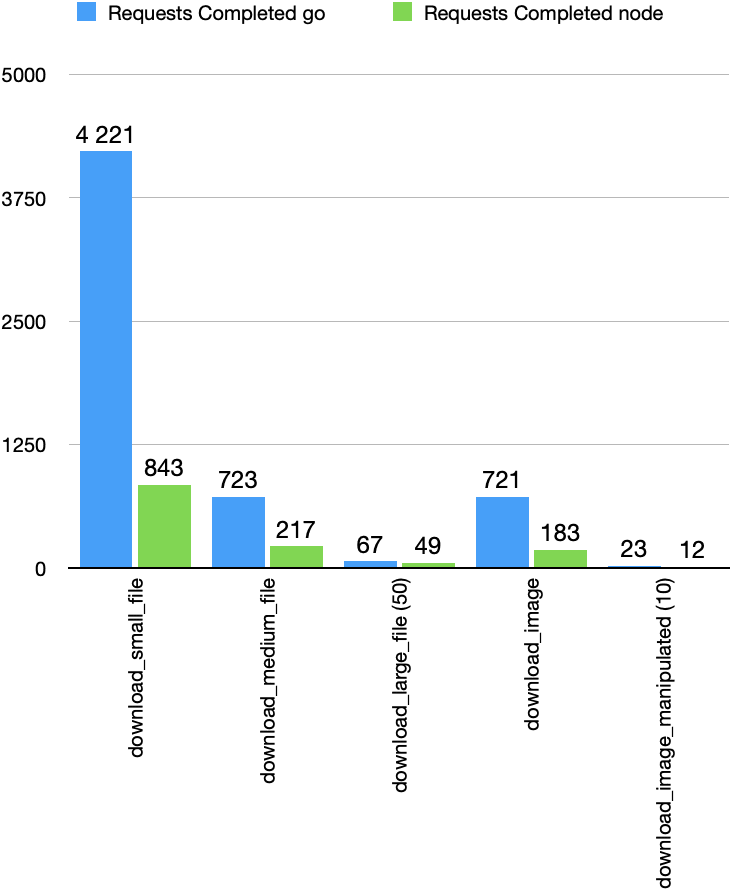
As you can see the number of requests we were able to serve under each scenario improved substantially, especially for smaller files (5x)
RAM consumption
RAM is a limited resource and it is not easy to throttle it if a system is reaching its limits. Traditional systems have relied on swapping to disk but this has a dramatic impact on overall performance so it is not an option in modern systems. Instead, modern systems rely on restarting the service when a threshold is reached. It is for this reason that peak memory usage under different scenarios is important, if you reach a certain value your service is restarted, if the service is restarted, it can't serve requests. Below you can see peak usage under the different scenarios described above:
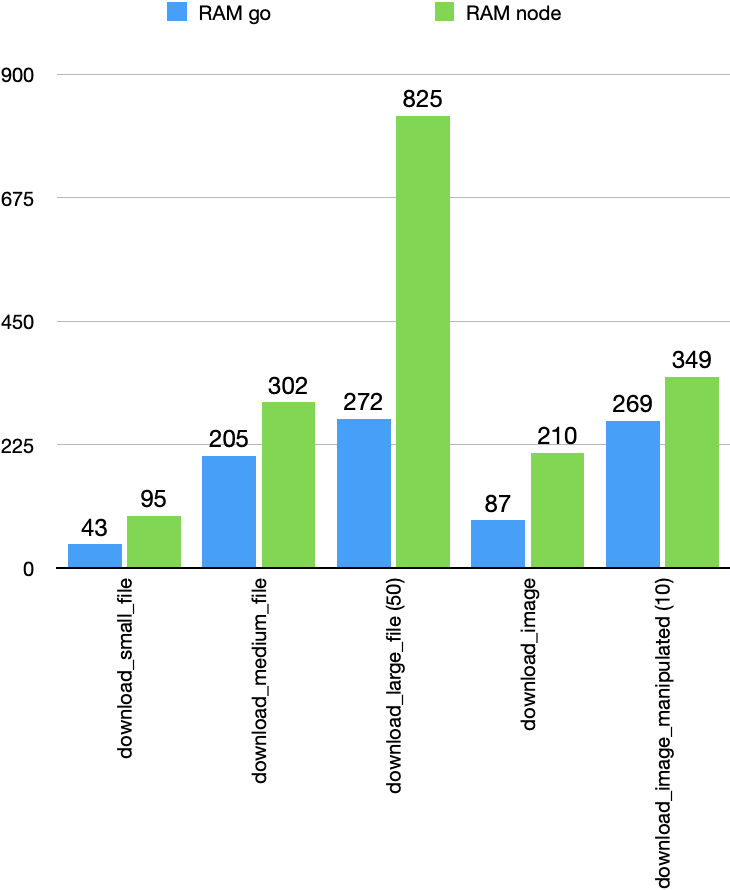
As you can see we managed to improve considerably this metric under all scenarios, especially when downloading large files. If you keep in mind that we were also serving up to 5x more requests this is a very good result.
Response times
Another important metric is response time, here we are looking at two units; minimum response time, which will tell us what is the response when the system is not under pressure, and the P95 which will tell us what was at most the response time for most users (including when the system was under pressure).
Let's start by looking at the minimum response time:
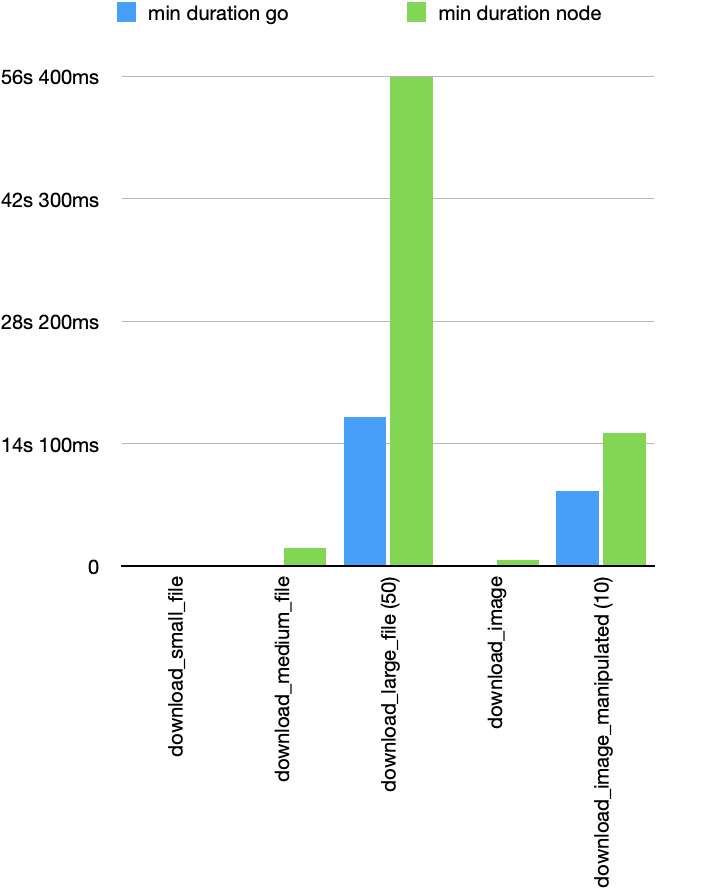
It is hard to see in the test case download_small_file but we improved the response time in that scenario from 29ms in the Node.js case to 7ms in the Golang case. This is a 4x improvement we see across the rest of the scenarios except download_image_manipulated, where we see around a 2x improvement. (we will talk about this scenario later).
And now let's look at the P95

Here we also see a 4x improvement for most cases with the exception of download_image_manipulated or download_large_file where we see substantial improvements but not as dramatic as the rest. This makes sense as downloading large files is going to be I/O NET bound while manipulating images is going to be CPU bound but even then we are happy to see this substantial improvement.
Manipulating images
I wanted to single out the case download_image_manipulated as it is an interesting case. For performance reasons, both versions of Hasura Storage rely on a C library called libvips, this is the reason why Node.js is performing quite nicely here despite the CPU limitations we introduced. However, it is nice to see that even realizing both services are using the same underlying C library we managed to improve all metrics significantly
Deploying the service to production
After the service was rewritten and tested we deployed the service to production. As soon as it was deployed we could see the benefits almost immediately. Below you can see RAM usage in one of the nodes of our cluster:

As you can see we reduced our memory footprint by almost 40%, a significant improvement that will let us serve more users and traffic without increasing our overall infrastructure bill.
Conclusion
We decided to rewrite the service to improve performance metrics and after benchmarking both services side by side we can unequivocally claim that we managed to improve all metrics significantly. We expect to be able to serve more requests while utilizing fewer resources and while also improving the response times for our users which I am sure they will appreciate.

Top comments (0)