
Shifting left isn't just about testing your code and automating the build and deployment process. It's about monitoring and testing your CI and CD pipelines, too.
In this post, you’ll learn how to monitor your GitLab jobs and pipelines using OpenTelemetry and the New Relic GitLab quickstart. After you're finished, you'll be able to:
- Track key metrics on your GitLab pipelines in a pre-built dashboard, such as how long your jobs are taking and how often they are failing.
- Visualize jobs and pipeline executions as distributed traces with logs in context.
- Pinpoint where issues are coming from in your pipelines.
- Create alerts on your GitLab pipelines.
The next image shows a New Relic dashboard with some of the GitLab metrics you’ll be able to see.
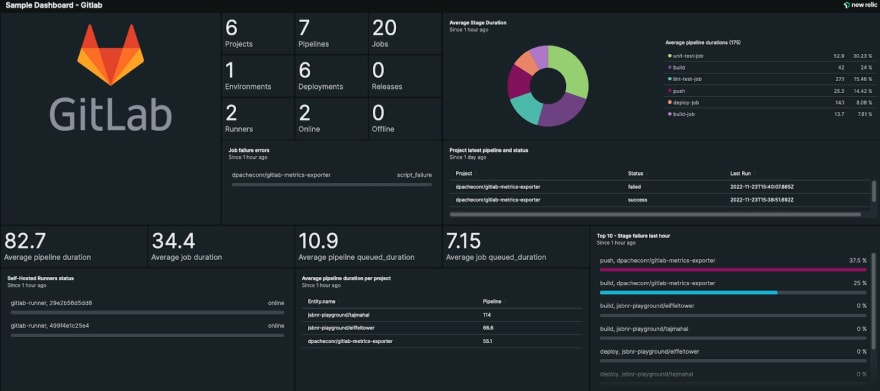
With this integration, you can shift left and get observability for the build and deploy phases of the DevOps lifecycle.
How the integration works
The New Relic GitLab integration is split into two parts for ease of use. Both parts run as jobs in your existing or new GitLab pipelines. You’ll learn how to integrate each part in the next section.
New Relic exporter: Add this job to the end of each of your pipelines to export your pipeline data as logs and traces to New Relic. You’ll be able to use the distributed trace viewer to inspect each pipeline run as well as explorer logs in the log explorer.
New Relic metrics exporter: This job should be scheduled. It exports GitLab data for all your projects, pipelines, jobs, runners, environments, deployment, and releases. You can configure which groups and projects are included. You can also run this as a standalone container outside GitLab.
Let’s look at some examples that show what you can visualize in New Relic after you’ve enabled the integration.
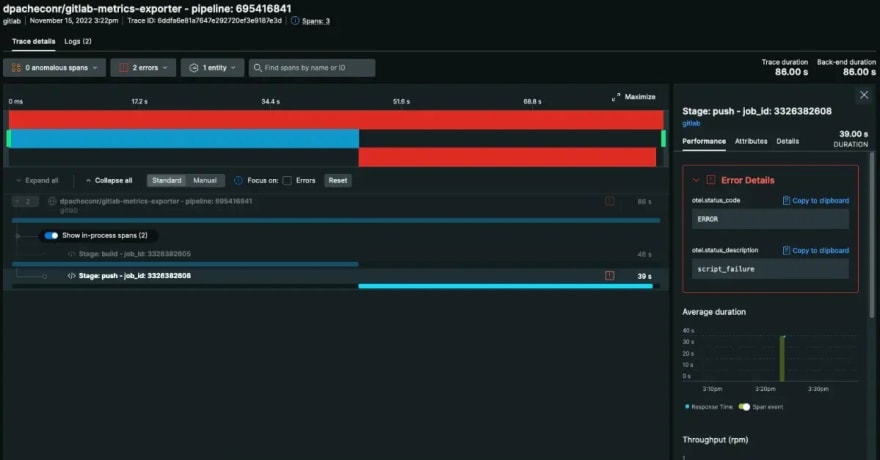
The following distributed trace captured by the New Relic exporter shows a job that contains an error with associated logs in context.
The next two images show metrics captured by the New Relic metrics exporter.

The next image shows GitLab resources as log events with the configured attributes.

Configuring the exporters
Both exporter integrations are set up similarly, but with one key difference:
- The New Relic exporter needs to be set up for each pipeline you want to report data for.
- The New Relic metrics exporter only needs to be set up once.
Prerequisites:
Before setting up the integration, you will need both a GitLab token and a New Relic ingest API key.
- Follow these steps in the API documentation to generate a New Relic ingest API key.
- Generate a GitLab API Token with “read_api” access.
- In the top-right corner, select your avatar.
- Select Edit profile.
- On the left sidebar, select Access Tokens.
- Enter a name and optional expiration date for the token.
- Select the “read_api” scope.
- Select Create personal access token.
Setting up the New Relic exporter
The New Relic exporter should be configured to run as a child job at the end of your project pipeline. It will ship the data from the pipeline to New Relic as a distributed trace with the logs being reported as logs in context.
Step one: Create CI/CD variables in GitLab
First, you need to set up your CI/CD variables in GitLab. In addition to the required GitLab token and New Relic API key, there are also several optional variables.
To add or update variables in GitLab for your project:
- Go to your project’s Settings > CI/CD and expand the Variables section.
- Select Add variable and fill in the details for the following required variables. Make sure that both variables are masked. GLAB_TOKEN provides access to the GitLab API. Add the GitLab API token you created in the previous section. NEW_RELIC_API_KEY is the ingest API key you created in the previous section.
- You can also update the following optional variables. Each configuration option should be set up in GitLab as a pipeline environment variable. By default, these optional variables are already set to automatically export job logs to New Relic. 1.OTEL_EXPORTER_OTEL_ENDPOINT is the New Relic OTEL endpoint and includes a port. By default, it’s set to https://otlp.nr-data.net:4318 in the US and https://otlp.eu01.nr-data.net:4318 in the EU. 2.GLAB_EXPORT_LOGS is used to export job logs to New Relic. This variable is a boolean that’s set to true by default.
- GLAB_ENDPOINT is the GitLab API endpoint. It’s set to https://gitlab.com by default.
Step two: Add the pipeline configuration for the exporter
- Create a file called new-relic-exporter.yml in the root directory of the GitLab project, repository, or branch you want to monitor.
Add the following pipeline code. The New Relic image is provided for testing purposes. It’s recommended that you use your own image of the exporter in production. You can build your own image based on the repository.
stages:
- new-relic-exporter
new-relic-exporter:
 rules:
   - when: always
 image:
   name: docker.io/dpacheconr/gitlab-exporter:1.0.0
 stage: new-relic-exporter
 script:
   - echo "Done"
Ensure that the rule is set to always so that the exporter runs even if previous jobs fail.
Step three: Add the exporter job to your existing pipeline
In your .gitlab-ci.yml file, add a new stage with the name new-relic-exporter to your stages block as shown in the next code snippet. This should be set as the last stage in the list.
stages:
…existing stages…
- new-relic-exporter
Configure the new-relic-exporter stage block as shown in the next code snippet:
new-relic-exporter:
 stage: new-relic-exporter
 inherit:
   variables: true
 variables:
   CI_PARENT_PIPELINE: $CI_PIPELINE_ID
 trigger:
   include:
     - local: new-relic-exporter.yml
Step four: Test and confirm that New Relic is receiving data
Commit your code to run your pipeline and confirm that the New Relic Exporter job runs as the final job in the pipeline.
Log into New Relic, go to Services - OpenTelemetry, and select the entity. It will have the same name as the project, repo, or branch that you are monitoring. Select the Distributed Traces tab and confirm that you can see a trace for your pipeline. Sometimes it takes a few minutes for the first trace to appear. The next image shows an example of a trace from the exporter.

An example of a trace from the exporter in the distributed traces dashboard in New Relic.
Next, go to the Logs tab and confirm that you can see your pipeline logs appearing.

Log events in New Relic show GitLab resources.
If there is no data, ensure that you have correctly set up the environment variables with the appropriate keys. In GitLab, you can check the New Relic exporter job output for additional debugging information.
Setting up the New Relic metrics exporter
The New Relic metrics exporter is standalone and does not need to be attached to an existing project pipeline. You should run it in its own project pipeline, but you can add it to an existing pipeline if you prefer.
This gathers data from the GitLab API about your projects, pipelines, jobs, runners, environments, deployments, and releases, then exports the data to New Relic as a mixture of metrics and logs.
To get the latest data from your accounts, you should run the New Relic metrics exporter on a regular basis. At least once per hour is recommended.
Step one: Create a new project
Create a new GitLab project and give it a descriptive name like New Relic metrics exporter.
Step two: Create CI/CD variables in GitLab
The exporter job has a number of configurable options which are provided as CI/CD environment variables. You must supply a GitLab token and New Relic API key.
You also need to provide a regular expression to define which projects and groups you’d like the exporter to monitor. Your GitLab token may have access to data you don’t want to export so take care to set this up so that only the projects and groups you are interested in are captured.
The other configurations are optional. Each configuration option should be set up as a pipeline environment variable. See the README for a list of the configuration options available along with their default values. The defaults with no additional configuration will run the job every 60 minutes.
To add or update variables in project settings:
- Go to your project’s Settings > CI/CD and expand the Variables section.
- Select Add variable and add your GLAB_TOKEN and NEW_RELIC_API_KEY. Don’t forget to mask both variables.
- Add or update any optional variables as needed for your project. If you want to change the frequency of the job to a value other than 60 minutes, you can do so with the optional variable GLAB_EXPORT_LAST_MINUTES.
Step three: Create your pipeline definition
If you have created a new project for this exporter as recommended, you will need to create the pipeline definition file .gitlab-ci.yml in the root of your project. Add the pipeline code shown in the next snippet.
stages:
- new-relic-metrics-exporter
 new-relic-metrics-exporter:
 rules:
   - when: always
 image:
   name: docker.io/dpacheconr/gitlab-metrics-exporter:1.0.0
   pull_policy: always
 stage: new-relic-metrics-exporter
 script:
   - echo "Done"
Step four: Test the pipeline
Run the pipeline and confirm that the New Relic metrics exporter job runs correctly with no errors, by checking the New Relic metrics exporter job output.
To execute a pipeline schedule manually, follow these steps in GitLab:
- On the top bar, select Main menu > Projects and find your project.
- On the left sidebar, select CI/CD > Schedules.
- Select Play to run the desired pipeline.
In the New Relic query builder, run the following NRQL query to ensure that New Relic is receiving data from the exporter:
SELECT * FROM Log where gitlab.source ='gitlab-metrics-exporter'
Go to Metrics & Events in New Relic and your GitLab metrics in the list of available metrics. These metrics will be prefixed with gitlab.
Metrics include pipeline, job duration, and queue duration. The next image shows the information on the duration of GitLab jobs.

New Relic dashboard shows duration of GitLab jobs.
Go to Logs in New Relic to see your log events. Apply the filter gitlab.source:"gitlab-metrics-exporter" to only see data sourced from new-relic-metrics-exporter. You will be able to see log data on all of your GitLab resources, including your projects, deployments, and runners.
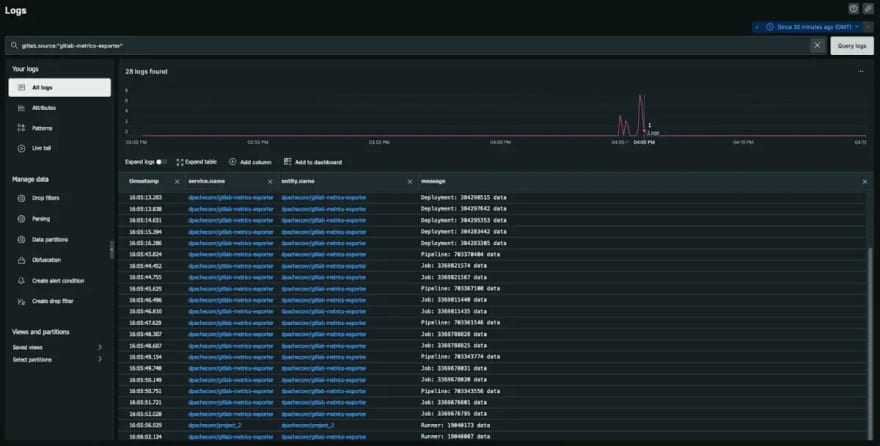
All log data showing in New Relic, including GitLab projects, deployments, and runners.
Step five: Create a pipeline schedule
Once you have confirmed the job is correctly sending data, you need to set up a schedule in GitLab to run the job regularly. The schedule pattern should match the value from GLAB_EXPORT_LAST_MINUTES. As discussed earlier in this post, the default is 60 minutes. Setting values that are different from the value in GLAB_EXPORT_LAST_MINUTES can lead to duplicate or missing data in New Relic.
To add a pipeline schedule, do the following in GitLab:
On the top bar, select Main menu > Projects and find your project.

On the left sidebar, select CI/CD > Schedules.

Select New schedule and add an interval pattern To run hourly, set the pattern to  0 * * * *.
Step six: Import the quickstart dashboard
We’ve built a starter dashboard to visualize your GitLab data and help you monitor your jobs and pipelines. You can install this dashboard using the GitLab quickstart and then further customize it as needed. To get this dashboard, simply follow these steps:
- Go to the Gitlab quickstart in New Relic Instant Observability and select Install now.
- Choose an account and select Begin installation.
- If you've already completed the earlier steps in this tutorial, select Done to move on to the next step.
- The quickstart deploys the resources to your account. Select See your data to get to the dashboard.
The following image shows the dashboard, which provides a summary of key metrics such as the number of runners available, the number of successful jobs, the top errors, and the job queue status.

Install the GitLab quickstart to get a dashboard template with prebuilt views to monitor your GitLab pipelines.
Conclusion
After you're done, you'll have complete visibility into your GitLab estate, from high-level metrics to logs and distributed traces. The next step is to consider adding alerts when certain thresholds are met, such as when jobs are taking too long, or when the number pipeline failures gets too high.
By sending your GitLab data to New Relic, you get observability into the building and deployment phases of the DevOps lifecycle, providing you with more insights into your DevOps practices and helping you shift left.
Read the full blog post at New Relic: Monitor GitLab with OpenTelemetry and New Relic.
Not an existing New Relic user? Sign up for a free account to get started! 👨💻

Oldest comments (0)