
NebulaGraph VEditor is a high-performance, highly customizable WYSIWYG visualization editing front-end library. NebulaGraph VEditor is based on SVG drawing, and it is easy to develop and customize the drawing by reasonably abstracting the code structure. It is extremely suitable for WYSIWYG editing and preview scenarios such as approval flow, workflow, kinship, ETL processing, and graph query. You can use VEditor to visually query, edit, and model graphs.
After continuous iterations and polishing, VEditor has been relatively perfect and now its code has been open-sourced. In this topic, I'd like to share some ideas and thoughts about its design.
Basic Features
- Customizable node and edge styles.
- Flat, simple, and clear code structure.
- Small map and magnetic lines.
- Shortcuts for common operations.
- History management.
- Lightweight, only 160 KB in size before compression.
Design Ideas
When I first came across the graph editor library, I just wanted to find one for customization and animation. After using many flowchart libraries, I found that most of the designs have bloated interfaces and complex classes. As a front-end developer, it was against my philosophy of writing simple, streamlined, and low-coupling code. So I decided to write a lightweight library myself to meet my needs.
The design concept of VEditor is to make it lighter for developers to use, reduce learning APIs, and reduce reliance on various libraries based on customizability and comprehensibility.
Architecture

The overall architecture is mainly through events to do the dependency management between entities, it is also recommended to get the state changes of the whole flowchart mainly through events.
Among them, the rendering process is semi-automatic rendering, and the rendering needs to be triggered manually after changing the flowchart data. Other state operations on the canvas will trigger the user-defined shape-rendering function to render nodes and lines.
Rendering Process
VEditor uses SVG to render the canvas. The declarative use of SVG makes the internal structure visible externally, which is convenient for developers to customize the rendering. Users can directly rewrite the relevant SVG styles outside and can directly use the SVG DOM (Document Object Model) to manipulate mouse events and animate nodes.
In terms of shape rendering, user-defined rendering functions are registered mainly through the exposed Shape interface. From this perspective, VEditor can perform rendering based on any rendering technique, as long as the rendering interface returns an SVGDOM, which can be an SVGElement or ForeignObject. I highly recommend managing SVC rendering through the DOM framework, such as React and Vue. In some cases, you can even wrap a Canvas to render WebGL nodes, which greatly extends the customizability.
In addition to nodes, node anchors and lines also support the object rendering after the corresponding interface is registered as Shape. In actual business scenarios, we use this feature to implement dynamic addition, deletion, and change of algorithm parameter anchors, the input and output anchors of OLTP queries (figure 1), filtering of edges in graph visualization, and step rendering (figure 2). You are welcome to apply for Explorer free trial. Just click here.


Data Structure Design
The data structure of VEditor is similar to most libraries, but it will not destroy the user's object reference, that is, when the user mounts the relevant data to the node or line object, it will be aligned and reserved, so that it will be convenient for the user to mount the relevant data to vertices after vertices or edges are configured. Therefore, the Redo, Undo, etc. operations of the history will store the user's data as snapshots.
Performance Design
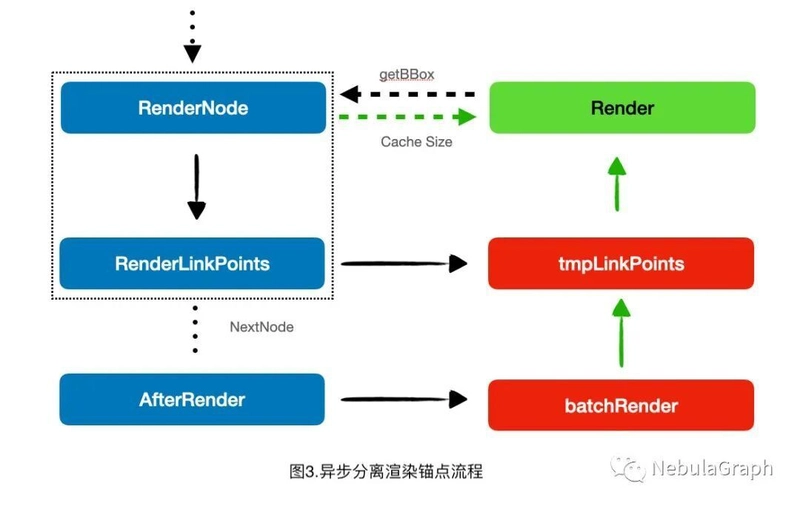
It is well known that SVG has a much worse performance than Canvas for rendering at small resolutions, which is a disadvantage that comes with increased ease of use. This is especially obvious when initializing a large number of more complex or animated nodes. To address this situation, the data rendering part of VEditor uses an asynchronous process, putting the rendering of anchors into the next event loop to avoid the browser-forced redrawing caused by the large number of bounding boxes fetched during the synchronization process. After the drawing is finished, the corresponding nodes are cached to avoid repeated fetching.
When adding nodes or lines, the DOM feature of SVG will let the browser do dirty rendering automatically, so the performance of incremental rendering is not much different from Canvas, but mainly slower when interacting and animating, which leads to a lot of DOM redrawing. The current design performance target is 1000 nodes with complex shapes for smooth rendering, which is easy to achieve in flowchart editing scenarios.
Interaction Design
VEdtior provides Dagre-based directed graph layouts by default. It automatically centers all nodes after Dagre is optimized and called. At the same time, it provides an adaptive size function. Unlike other libraries, the coordinates of the current nodes will be reset to the adaptive position, and the adaptive position can be restored directly after the user saves the current data.
VEditor's mini-map adopts canvg rendering, which directly converts SVG to Canvas, which can guarantee the accuracy of mini-map and reduce the performance loss at the same time. In terms of interaction, VEditor allows you to zoom in and out of the canvas, and drag and drop elements.
Future Plans
VEditor is expected to be a data editor and renderer for any field by expanding the scenarios where it can be used. In addition, we will continue to improve the performance and user experience of VEditor while supporting the following features in the future.
Box selector and multi-select operations.
Undirected graphs and double arrows
Further performance optimizations
👉 GitHub open source address: https://github.com/vesoft-inc/nebulagraph-veditor

Top comments (0)