In a previous post of this series [1], we introduced how to use the Python-based graph analysis library NetworkX [2] and NebulaGraph [3] to analyze the character relationships in “Game of Thrones”.
In this post, we are going to explore how to use the Java-based graph analysis library JGraphT [4] and the diagramming library mxGraph [5] to visualize the changes of correlation between the S&P 100 Index stocks [6] over time.

Dataset Processing
The main analysis method used in this post refers to [7] and [8]. There are two datasets: the vertex set and the edge set.
Stock Data (Vertex Set)
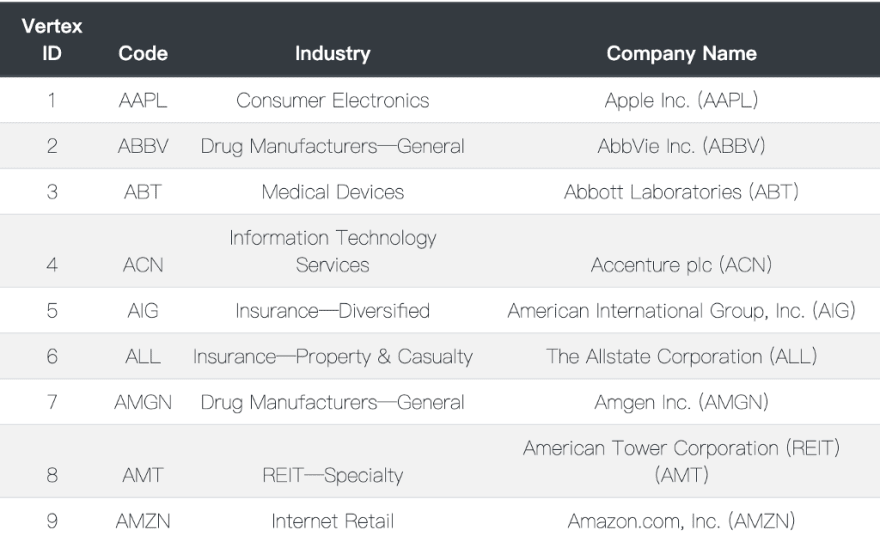
Select the following S&P 100 Index stocks, and model each stock as a vertex. The properties of each vertex are the stock code and the industry of the listed company.
Table 1: The vertex set sample
Stock Relationship (Edge/Relationship Set)

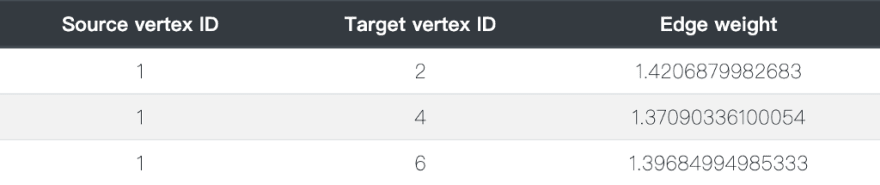
Through such processing, we get the range of the distance as [0,2]. That means the more distant the two stocks, the lower the correlation between their return rates.
Table 2: The edge set sample
Such a vertex set and an edge set form a graph network, which can be stored in the NebulaGraph database.
JGraphT
JGraphT is an open-source Java class library that provides not only a variety of efficient and common graph data structures but also many useful algorithms for solving the most common graph problems. The features of JGraphT are as follows:
- Supports directed edges, undirected edges, weighted edges, non-weighted edges, etc.
- Supports simple graphs, multigraphs, and pseudographs.
- Provides dedicated iterators (DFS, BFS, etc.) for graph traversals.
- Provides a large number of commonly used graph algorithms, such as path lookup, isomorphism detection, coloring, common ancestors, wandering, connectivity, matching, cycle detection, partitioning, cutting, flow, and centrality.
- Provides easy import from/export to GraphViz. The exported GraphViz file can be applied by the visualization tool Gephi for analysis and demonstration.
- Supports convenient graph network generating while used with tools such as JGraphX,mxGraph,and Guava Graphs Generators.
Next, let’s try it out.
- Create a directed graph in JGraphT.
import org.jgrapht.*;
import org.jgrapht.graph.*;
import org.jgrapht.nio.*;
import org.jgrapht.nio.dot.*;
import org.jgrapht.traverse.*;

import java.io.*;
import java.net.*;
import java.util.*;

Graph<URI, DefaultEdge> g = new DefaultDirectedGraph<>(DefaultEdge.class);

URI google = new URI("http://www.google.com");
URI wikipedia = new URI("http://www.wikipedia.org");
URI jgrapht = new URI("http://www.jgrapht.org");
- Add vertices.
g.addVertex(google);
g.addVertex(wikipedia);
g.addVertex(jgrapht);
- Add edges.
// Add edges to create a linked structure

g.addEdge(jgrapht, wikipedia);
g.addEdge(google, jgrapht);
g.addEdge(google, wikipedia);
g.addEdge(wikipedia, google);
The NebulaGraph database
JGraphT usually uses local files as data sources. That’s fine when you’re doing static network research, but if the graph network is constantly changing, like a graph network of the stock data, which changes every day, it’s a little bit of a hassle to generate a new static file, then load it and then analyze it every time. Ideally, the entire change process can be written to a database persistently, and subgraphs or the complete graph can be loaded directly from the database in real-time for analysis. In this post, we use NebulaGraph as the graph database for storing the graph data.
NebulaGraph’s Java client nebula-java [11] provides two ways of accessing NebulaGraph. One is interacting with the query engine layer [13] through the graph query language nGQL [12], which is usually suitable for accessing subgraphs and supports complex semantics; The other is to directly interact with the underlying storage layer (the storaged process) [14] through the APIs, which is used to obtain the complete set of vertices and edges. In addition to accessing NebulaGraph itself, nebula-java provides examples of interacting with Neo4j [15], JanusGraph [16], Spark [17], and others.
In this post, we use the APIs to access the storage layer (the storaged process) directly to get all the vertices and edges. The following two interfaces can be used to read all the vertex and edge data.
// space is the name of the graph space to be scanned, and returnCols is the vertex/edge and its properties to be read.
// Format of returnCols parameter: {tag1Name: prop1, prop2, tag2Name: prop3, prop4, prop5}
Iterator<ScanVertexResponse> scanVertex(
            Stringspace, Map<String, List<String>>returnCols);
Iterator<ScanEdgeResponse> scanEdge(
            Stringspace, Map<String, List<String>>returnCols);
- Initialize a client and a ScanVertexProcessor. ScanVertexProcessor is used to decode the read vertex data:
MetaClientImpl metaClientImpl = new MetaClientImpl(metaHost, metaPort);
metaClientImpl.connect();
StorageClient storageClient = new StorageClientImpl(metaClientImpl);
Processor processor = new ScanVertexProcessor(metaClientImpl);
- Call the scanVertex interface, which returns an iterator for the scanVertexResponse object:
Iterator<ScanVertexResponse> iterator =
                storageClient.scanVertex(spaceName, returnCols);
- Keep reading the data in the scanVertexResponse object that the iterator points to until all of the data is read. The read vertex data is saved and later added to the graph structure of JGraphT.
while (iterator.hasNext()) {
  ScanVertexResponse response = iterator.next();
  if (response == null) {
    log.error("Error occurs while scan vertex");
    break;
  }

  Result result = processor.process(spaceName, response);
  results.addAll(result.getRows(TAGNAME));
}
Reading edge data is similar to the above process.
Analyze the Graph in JGraphT
- Create an undirected and weighted graph in JGraphT :
Graph<String, MyEdge> graph = GraphTypeBuilder
                .undirected()
    .weighted(true)
    .allowingMultipleEdges(true)
    .allowingSelfLoops(false)
    .vertexSupplier(SupplierUtil.createStringSupplier())
    .edgeSupplier(SupplierUtil.createSupplier(MyEdge.class))
    .buildGraph();
- Add the vertex and edge data read in the last step from the NebulaGraph space to the graph:
for (VertexDomain vertex : vertexDomainList){
    graph.addVertex(vertex.getVid().toString());
    stockIdToName.put(vertex.getVid().toString(), vertex);
}

for (EdgeDomain edgeDomain : edgeDomainList){
    graph.addEdge(edgeDomain.getSrcid().toString(), edgeDomain.getDstid().toString());
    MyEdge newEdge = graph.getEdge(edgeDomain.getSrcid().toString(), edgeDomain.getDstid().toString());
    graph.setEdgeWeight(newEdge, edgeDomain.getWeight());
}
- Like the analysis algorithms mentioned in [7] and [8], use Prim’s minimum-spanning tree algorithm for the preceding graph and call the encapsulated drawGraph interface to draw the graph.
Prim’s algorithm is an algorithm in graph theory that searches for a minimum spanning tree in a weighted connected graph. In other words, the tree formed by the edge subset searched by this algorithm not only includes all vertices in the connected graph but also has the minimum sum of weights of all edges.
SpanningTreeAlgorithm.SpanningTree pMST = new PrimMinimumSpanningTree(graph).getSpanningTree();

Legend.drawGraph(pMST.getEdges(), filename, stockIdToName);
- The drawGraph method encapsulates parameter settings such as the layout of the drawing. This method renders stocks in the same sector in the same color, grouping close stocks together.
public class Legend {

...

  public static void drawGraph(Set<MyEdge> edges, String filename, Map<String, VertexDomain> idVertexMap) throws IOException {
     // Creates graph with model
     mxGraph graph = new mxGraph();
     Object parent = graph.getDefaultParent();

     // set style
     graph.getModel().beginUpdate();
     mxStylesheet myStylesheet = graph.getStylesheet();
     graph.setStylesheet(setMsStylesheet(myStylesheet));

     Map<String, Object> idMap = new HashMap<>();
     Map<String, String> industryColor = new HashMap<>();

     int colorIndex = 0;

     for (MyEdge edge : edges) {
       Object src, dst;
       if (!idMap.containsKey(edge.getSrc())) {
         VertexDomain srcNode = idVertexMap.get(edge.getSrc());
         String nodeColor;
         if (industryColor.containsKey(srcNode.getIndustry())){
           nodeColor = industryColor.get(srcNode.getIndustry());
         }else {
           nodeColor = COLOR_LIST[colorIndex++];
           industryColor.put(srcNode.getIndustry(), nodeColor);
         }
         src = graph.insertVertex(parent, null, srcNode.getName(), 0, 0, 105, 50, "fillColor=" + nodeColor);
         idMap.put(edge.getSrc(), src);
       } else {
         src = idMap.get(edge.getSrc());
       }

       if (!idMap.containsKey(edge.getDst())) {
         VertexDomain dstNode = idVertexMap.get(edge.getDst());

         String nodeColor;
         if (industryColor.containsKey(dstNode.getIndustry())){
           nodeColor = industryColor.get(dstNode.getIndustry());
         }else {
           nodeColor = COLOR_LIST[colorIndex++];
           industryColor.put(dstNode.getIndustry(), nodeColor);
         }

         dst = graph.insertVertex(parent, null, dstNode.getName(), 0, 0, 105, 50, "fillColor=" + nodeColor);
         idMap.put(edge.getDst(), dst);
       } else {
         dst = idMap.get(edge.getDst());
       }
       graph.insertEdge(parent, null, "", src, dst);
     }

     log.info("vertice " + idMap.size());
     log.info("colorsize " + industryColor.size());

     mxFastOrganicLayout layout = new mxFastOrganicLayout(graph);
     layout.setMaxIterations(2000);
     //layout.setMinDistanceLimit(10D);
     layout.execute(parent);

     graph.getModel().endUpdate();

     // Creates an image than can be saved using ImageIO
     BufferedImage image = createBufferedImage(graph, null, 1, Color.WHITE,
                                               true, null);

     // For the sake of this example we display the image in a window
     // Save as JPEG
     File file = new File(filename);
     ImageIO.write(image, "JPEG", file);

   }

  ...

}
- Visualize the data.
The color of each vertex in Figure 1 represents its industry. We can see that the stocks with high business similarity have been clustered together, but some stocks with no obvious correlation have also been clustered together, the reason for which needs to be studied separately.

Figure 1: Clustering based on the stock data from 2014–01–01 to 2020–01–01
- Some other dynamic exploration based on different time windows.
The preceding conclusion is mainly based on the stock aggregation from 2014–01–01 to 2020–01–01. We also made other attempts: Use a sliding window of 2 years and the same analysis method to observe if the clustered groups would change over time.

Figure 2: Clustering based on the stock data from 2014–01–01 to 2016–01–01
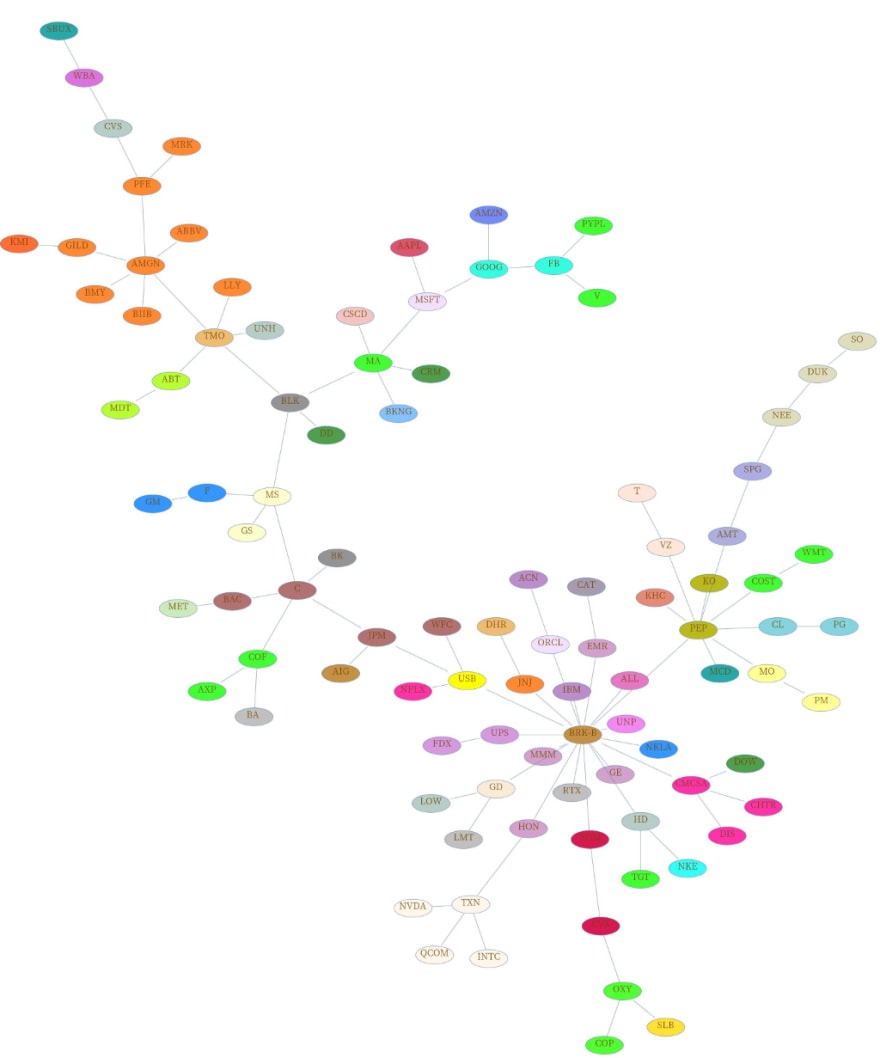
Figure 3: Clustering based on the stock data from 2015–01–01 to 2017–01–01

Figure 4: Clustering based on the stock data from 2016–01–01 to 2018–01–01

Figure 5: Clustering based on the stock data from 2017–01–01 to 2019–01–01

Figure 6: Clustering based on the stock data from 2018–01–01 to 2020–01–01
According to a rough analysis, with the change of time window, the clustering of stocks within most industries maintains relatively good, which means that with the change of time, all kinds of stocks within the same industry maintain relatively high correlation.
Disclaimer
This post should not be taken as investment advice. Due to the situation of trade suspension, circuit breakers, trading limits, transfers, mergers and acquisitions, changes of the main business, etc., the data processing in this post may be incorrect. We have not checked all the data piece by piece.
Limited by time, this post only selects the data of 100 stock samples in the past six years, and only adopts the method of minimum expansion tree to do the clustering and classification. In the future, maybe we can use larger data sets (such as U.S. stocks, derivatives, and digital currencies) to try more methods in machine learning.
For the code used in this post, please see [18].
References
[1] Analyzing Relationships in Game of Thrones With NetworkX, Gephi, and NebulaGraph (Part One) https://nebula-graph.io/posts/game-of-thrones-relationship-networkx-gephi-nebula-graph/
[2] Analyzing Relationships in Game of Thrones With NetworkX, Gephi, and NebulaGraph (Part Two) https://nebula-graph.io/posts/game-of-thrones-relationship-networkx-gephi-nebula-graph-part-two/
[3] NetworkX: a Python package for the creation, manipulation, and study of the structure, dynamics, and functions of complex networks. https://networkx.github.io/
[4] NebulaGraph: A powerfully distributed, scalable, lightning-fast graph database written in C++. https://nebula-graph.io/
[5] JGraphT: a Java library of graph theory data structures and algorithms. https://jgrapht.org/
[6] mxGraph: JavaScript diagramming library that enables interactive graph and charting applications. https://jgraph.github.io/mxgraph/
[7] Bonanno, Giovanni & Lillo, Fabrizio & Mantegna, Rosario. (2000). High-frequency Cross-correlation in a Set of Stocks. arXiv.org, Quantitative Finance Papers. 1. 10.1080/713665554.
[8] Mantegna, R.N. Hierarchical structure in financial markets. Eur. Phys. J. B 11, 193–197 (1999).
[10] https://gephi.org/
[11] https://github.com/vesoft-inc/nebula-java
[12] NebulaGraph Query Language (nGQL). https://docs.nebula-graph.io/manual-EN/1.overview/1.concepts/2.nGQL-overview/
[13] NebulaGraph Query Engine. https://github.com/vesoft-inc/nebula-graph
[14] Nebula-storage: A distributed consistent graph storage. https://github.com/vesoft-inc/nebula-storage
[15] Neo4j. www.neo4j.com
[16] JanusGraph. janusgraph.org
[17] Apache Spark. spark.apache.org.
[18] https://github.com/Judy1992/nebula_scan
Like what we do ? Star us on GitHub. https://github.com/vesoft-inc/nebula
Originally published at https://nebula-graph.io on November 12, 2020.

Top comments (0)