
Materialize organized an Online Hack Day a while ago. And they provided a structured streaming setup using dbt (ETL framework), Redpanda (queue), Materialize (database) and Metabase (visualization).
The initial setup was using flight data with OpenSky API to aggregate flight information. I re-purposed the structured streaming setup to use cryptocurrency data in a real-time dashboard.
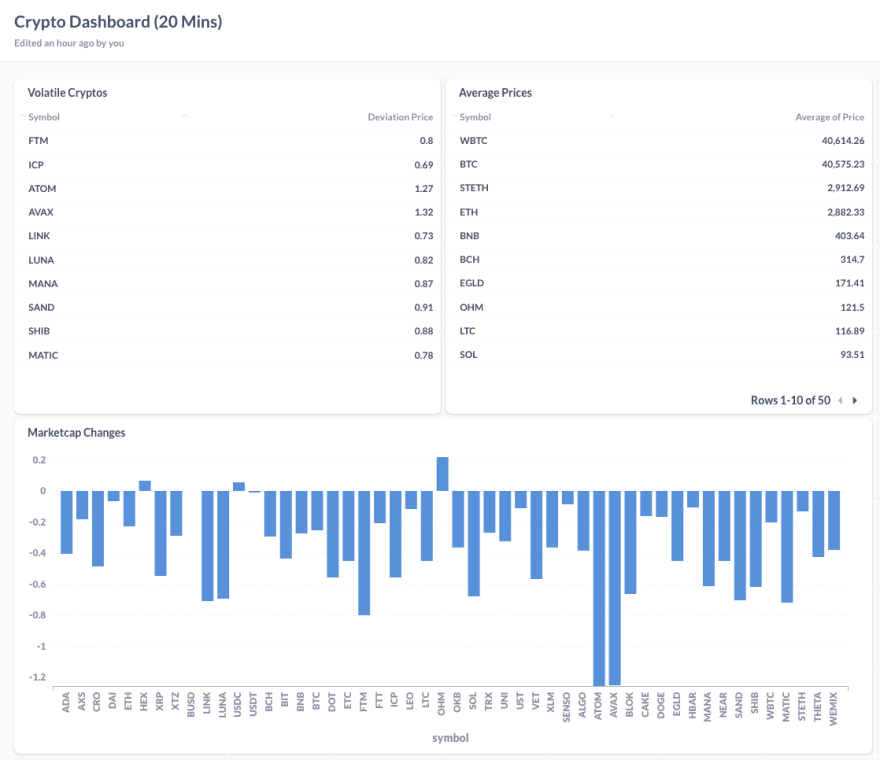
Without changing much of the setup, it was a great comfort to create a new producer via CoinRanking. Then I created two financial queries in dbt to answer the following questions in real-time:
- What is the difference of marketcap within the last 20 minutes per crypto currency?
- What are the most deviating cryptocurrencies within the last 20 minutes?
- What are the average prices per cryptocurrency within the last 20 minutes?
I connected the queries (materialized views in Materialize) to Metabase, to visualize my answers. Here is a screenshot from the resulting example dashboard in Metabase:
In this small memorial write-up, I will try to summarize the pipeline for this analysis. I aim to show the easiness of creating a real-time financial analysis with it.
Pipeline Summary
The pipeline that was created by Materialize had the following chronological order, and I re-purposed the same structure by changing the producer:
- Ingest real-time data with a Python producer into RedPanda
- Create a source from RedPanda in Materialize using dbt (raw data ingestion)
- Create a staging view in Materialize to type-cast JSON fields (staging ingested data)
- Create a materialized view(s) in Materialize to produce real-time windowed aggregations
- Use Metabase to visualize data The technologies relate to each other as the following diagram suggests:

The setup is initialized with a very diligent docker-compose file, created by @morsapaes. When we docker-compose up, we have the following services running on your local machine:
IMAGE                                               COMMAND                  PORTS                                                                NAMES
sample_project_data-generator                       "python -u ./crypto.…"                                                                        data-generator
sample_project_dbt                                  "/bin/bash"              0.0.0.0:8002->8080/tcp                                               dbt
metabase/metabase                                   "/app/run_metabase.sh"   0.0.0.0:3030->3000/tcp                                               metabase
docker.vectorized.io/vectorized/redpanda:v21.11.3   "/entrypoint.sh 'red…"   0.0.0.0:8081-8082->8081-8082/tcp, 0.0.0.0:9092->9092/tcp, 9644/tcp   redpanda
materialize/materialized:v0.20.0                    "tini -- materialize…"   0.0.0.0:6875->6875/tcp                                               materialized
CoinRanking Producer in a Nutshell
To fetch real-time CoinRanking data into RedPanda, we need a small script. The script needs to read data from CoinRanking within periods. Then it needs to flush the read data into the RedPanda instance. Since RedPanda is Kafka compatible, that is quite straight forward with Python Kafka client.
Producer script basically reads data from the CoinRanking API, using a token. Then it picks up the required fields from the API data requested. Lastly it ingests the list of coin information into RedPanda within every 10 seconds. Here is the compact script:
import logging
import requests
import schedule
from kafka import KafkaProducer

logging.basicConfig(
    level=logging.INFO,
    format="%(asctime)-7s %(levelname)-1s %(message)s",
    datefmt="%Y-%m-%d %H:%M:%S",
    handlers=[
        logging.StreamHandler(),
    ],
)
COIN_PAGE = "https://api.coinranking.com/v2/coins"
CRYPTO_TOPIC = "crypto"

TOKEN = os.getenv(
    "TOKEN",
    ".",
)
HEADERS = {"Authorization": f"access_token {TOKEN}"}
FREQUENCY_INGESTION = 10


def produce_list_of_coin_dict_into_queue(list_of_dict: list) -> None:
    producer = KafkaProducer(bootstrap_servers="redpanda:9092")
    for coin_with_model in list_of_dict:
        try:
            producer.send(
                topic=CRYPTO_TOPIC,
                value=dumps(coin_with_model).encode("utf-8"),
                key=uuid.uuid4().hex.encode("utf-8"),
            )
        except Exception as e:
            logging.error(f"The problem is: {e}!")
    producer.flush()


def get_json_api(page: str) -> tuple:
    get_request = requests.get(page, headers=HEADERS)
    assert get_request.status_code == 200, "Request not successful"
    return get_request.json(), get_request.status_code


def get_coin_model(coin: dict) -> dict:
    try:
        return {
            "uuid": coin.get("uuid"),
            "name": coin.get("name"),
            "symbol": coin.get("symbol"),
            "btc_price": coin.get("btcPrice"),
            "last_24h_volume": coin.get("24hVolume"),
            "marketcap": coin.get("marketCap"),
            "price": coin.get("price"),
            "timestamp": datetime.now().strftime("%Y-%m-%d %H:%M:%S"),
        }
    except Exception as e:
        logging.error(f"Exception: {e}")
        return {}


def coins_producer() -> None:
    all_coins, _ = get_json_api(COIN_PAGE)
    coins_with_model = get_all_coins_with_model(all_coins)
    produce_list_of_coin_dict_into_queue(coins_with_model)


if __name__ == "__main__":
    coins_producer()
    schedule.every(FREQUENCY_INGESTION).seconds.do(coins_producer)
    while True:
        schedule.run_pending()
        time.sleep(1)
By using this producer, we regularly ingest crypto data into RedPanda with a topic called crypto. We expect to asynchronously consume the ingested data from the topic crypto and use in our analyses.
RedPanda Source in Materialize
The project uses dbt adapter for Materialize. The adapter (dbt-materialize) is a Python package available on PyPI. This package allows us to use SQL + Jinja statements to efficiently transform streaming data and continuously update our data.
According to Materialize, the connected data sources are called source. Creating a source in Materialize is possible by introducing a queue connection with a simple DDL statement.
Since we make use of dbt, this is as easy as using the following lines:
{{
    config(
        materialized='source',
        tags=['crypto']
    )
}}

{% set source_name %}
    {{ mz_generate_name('rc_coins') }}
{% endset %}

CREATE SOURCE {{ source_name }}
FROM KAFKA BROKER 'redpanda:9092' TOPIC 'crypto'
  KEY FORMAT BYTES
  VALUE FORMAT BYTES
ENVELOPE UPSERT;
After defining the source, ingested data will be recognized by the database. However, we need to convert the string to the database encoding and JSON. This is required for column mapping, as our data is stored in JSON object literals. In the end we can map the column values by accessing and casting the object values:
{{
    config(
        materialized='view',
        tags=['crypto']
    )
}}

WITH converted_casted AS (
    SELECT
        CAST(CONVERT_FROM(data, 'utf8') AS jsonb) AS data
    FROM {{ ref('rc_coins') }}
)
SELECT
    (data->>'uuid')::string as uuid,
    (data->>'name')::string as name,
    (data->>'symbol')::string as symbol,
    (data->>'btc_price')::numeric as btc_price,
    (data->>'last_24h_volume')::numeric as last_24h_volume,
    (data->>'marketcap')::numeric as marketcap,
    (data->>'price')::double as price,
    (data->>'timestamp')::timestamp as timestamp
FROM converted_casted
Materialized Views in Materialize
One of the great features of Materialize is their materialized view. This is a streaming computation of a SELECT query in incrementally updated materialized views.
As in every structured streaming framework, to provide a valid analysis we can benefit from defining a set of assumptions for windowing and lateness of data (grace periods). Currently, Materialize makes use of mz_logical_timestamp() function to define windowing and grace periods of data. The mz_logical_timestamp() function represents the current timestamp in milliseconds at the time of the query execution.
The questions require us to keep track of the last 20 minutes of data. Theoretically we need to analyze data in sliding windows. Following the nice explanation in Materialize documentation, using the mz_logical_timestamp() we can compute the answering queries of our crypto analysis for the past 20 minutes.
{{
    config(
        materialized ='materializedview',
        tags=['crypto']
    )
}}

{# 20 mins #}
{% set slide_threshold = '1200000' %}

WITH with_casted_insertion AS (

    SELECT *, extract(epoch from timestamp) * 1000 AS inserted_at
    FROM {{ ref('stg_crypto') }}

)

SELECT * FROM with_casted_insertion
WHERE TRUE
    AND mz_logical_timestamp() >= inserted_at
    AND mz_logical_timestamp() < inserted_at + {{ slide_threshold }}
In the producer we did not provide an insertion date in milliseconds. By using SQL statements we can convert the field timestamp into milliseconds and call this as inserted_at. This new field can be our benchmark for windowing.
The mz_logical_timestamp() and its usage is quite complicated. I suggest reading the nice documentation page from Materialize to see other use cases and their explanations.
On top of the materialized view created above we can write our analytics queries to expose in a dashboarding tool, such as Metabase. The analytics queries would use dbt functionalities as well, materialized as materializedview. You can find the resulting queries in the repository.
Resulting Lineage and Last Words
After obtaining the analytics queries, all we need to do is to run only once the crypto tagged models from dbt:
dbt run -m tag:crypto
The output from dbt will be as:
19:01:19  Found 10 models, 0 tests, 0 snapshots, 0 analyses, 180 macros, 0 operations, 0 seed files, 0 sources, 0 exposures, 0 metrics
19:01:19
19:01:19  Concurrency: 1 threads (target='dev')
19:01:19
19:01:19  1 of 5 START source model public.rc_coins....................................... [RUN]
19:01:19  1 of 5 OK created source model public.rc_coins.................................. [CREATE SOURCE in 0.08s]
19:01:19  2 of 5 START view model public.stg_crypto....................................... [RUN]
19:01:19  2 of 5 OK created view model public.stg_crypto.................................. [CREATE VIEW in 0.05s]
19:01:19  3 of 5 START materializedview model public.fct_crypto_sliding_window............ [RUN]
19:01:19  3 of 5 OK created materializedview model public.fct_crypto_sliding_window....... [CREATE VIEW in 0.06s]
19:01:19  4 of 5 START materializedview model public.marketcap_changes.................... [RUN]
19:01:19  4 of 5 OK created materializedview model public.marketcap_changes............... [CREATE VIEW in 0.06s]
19:01:19  5 of 5 START materializedview model public.volatile_cryptos..................... [RUN]
19:01:20  5 of 5 OK created materializedview model public.volatile_cryptos................ [CREATE VIEW in 0.05s]
19:01:20
19:01:20  Finished running 1 source model, 1 view model, 3 materializedview models in 0.38s.
19:01:20
19:01:20  Completed successfully
19:01:20
19:01:20  Done. PASS=5 WARN=0 ERROR=0 SKIP=0 TOTAL=5
The resulting dbt lineage diagram would be as follows:

Real-time analytics is used in getting immediate insights for financial data, news sources, social media reactions and healthcare. In most of the cases SQL is enough for obtaining basic insights in such systems. Thus, SQL dbt in combination with Materialize improve the efficiency of developing real-time analytics pipelines. The setup that was provided in the Hackday was a great example of this.
The biggest challenge after this point would be the maintenance of these pipelines. Luckily, there is sufficient information on integrating both RedPanda and Materialize with monitoring tools. As a next reading tip, I would nerdly suggest their documentation pages:


Top comments (1)
Interesting. the question is whether it couldn't be easier.... in few minutes.
How about such a solution?
https://www.youtube.com/watch?v=BPLKPVVyHNY&list=PLxkW0N98bb3LJ97_ip8WuCKp0WYB2b3zb&index=3