
Making charts in React is always tricky. We need to take care of a number of things like chart type, there design, colors, background, values, dataSets, options, etc. In this article we will gonna learn how to create charts using Chart.js with React.
Chart.js
Its a simple JavaScript library which is used to create various type of charts using Html5 Canvas element. It supports 8 different type of charts. Chart.js used Canvas which is great in terms of performance and IE11+ also supports it.
It will redraw the chart on resize of your browser window so that responsiveness is always taken care of. Chart.js also supports animation.
Installation
To use this library with React you need to install there package first.
npm install chart.js --save
Usage
We can simply import it like this.
import Chart from 'chart.js';
Chart.js uses canvas to draw the charts for that reason we need to put a canvas element in our Render method.
<canvas id="myChart" width="400" height="400"></canvas>
Once our component is rendered we can add our chart in componentDidMount if you are using class Component otherwise use useEffect for that.
Get the reference for canvas element.
const ctx = document.getElementById("myChart");
Now simply pass data and chart to that canvas element.
new Chart(ctx, {
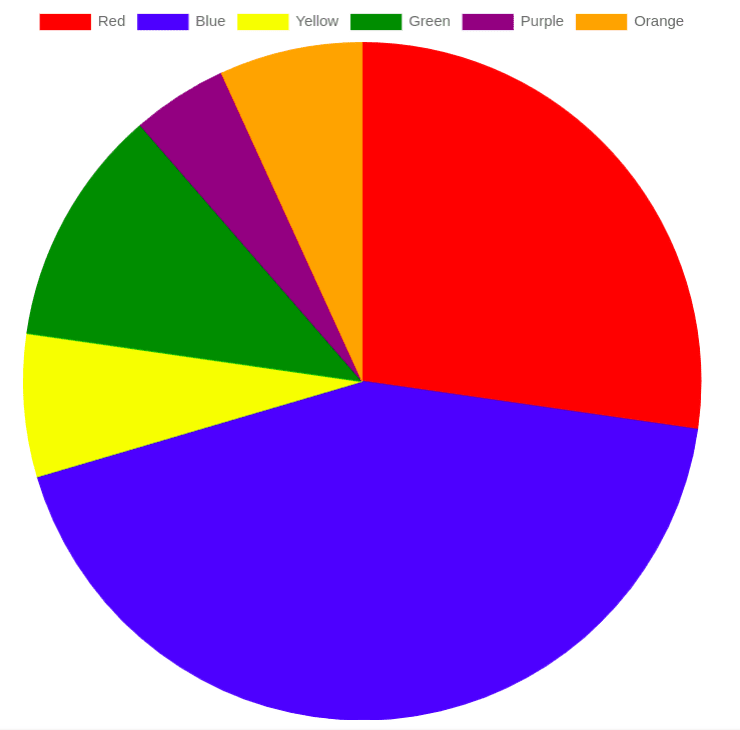
type: "pie",
data: {
labels: ["Red", "Blue", "Yellow", "Green", "Purple", "Orange"],
datasets: [
{
label: "# of Votes",
data: [12, 19, 3, 5, 2, 3],
backgroundColor: [
"Red",
"Blue",
"Yellow",
"Green",
"Purple",
"Orange"
],
borderColor: ["Red", "Blue", "Yellow", "Green", "Purple", "Orange"],
borderWidth: 1
}
]
}
});
Our whole component will gonna look like this.
import React, { useEffect } from "react";
import Chart from "chart.js";
import "./styles.css";

export default function App() {
  useEffect(() => {
    const ctx = document.getElementById("myChart");
    new Chart(ctx, {
      type: "pie",
      data: {
        labels: ["Red", "Blue", "Yellow", "Green", "Purple", "Orange"],
        datasets: [
          {
            label: "# of Votes",
            data: [12, 19, 3, 5, 2, 3],
            backgroundColor: [
              "Red",
              "Blue",
              "Yellow",
              "Green",
              "Purple",
              "Orange"
            ],
            borderColor: ["Red", "Blue", "Yellow", "Green", "Purple", "Orange"],
            borderWidth: 1
          }
        ]
      }
    });
  });
  return (
    <div className="App">
      <canvas id="myChart" width="400" height="400" />
    </div>
  );
}
You will see output similar to this.
Checkout this example on codesandbox.

Using the same way you can create all different kind of charts by just changing the type in useEffect. I hope you have learned how to create charts using Chart.js with React


Top comments (3)
Hi Saini,
I copied your code in a file \src\components\mychart.js (export default function myChart() ), and uses it in the render of another class with <myChart />.
And I got this message :
Failed to compile
./src/components/myChart.js
Line 10:3: React Hook "useEffect" is called in function "myChart" which is neither a React function component or a custom React Hook function react-hooks/rules-of-hooks
What is the problem ?
The problem was the name of my function : myChart().
It has to be MyChart(), with a capital letter !
Now, it works, but there's no color...
Works well if we don't have to use it inside loop, because in that way it'll break the Rules of Hooks. Any workaround for that?