
Introduction
In a typical enterprise, there would be multiple Azure subscriptions managed across various tenants. Each tenant would have multiple subscriptions for respective environments. This blog focuses on managing the multiple Azure Subscriptions with Serverless360. Let us take a simple scenario to have a better understanding of how Serverless360 overcome the challenges faced in the Azure portal with the help of Composite Application.
Scenario
Let us consider a scenario where an organization named Fly Wheel Cab, with multiple systems like Vehicle Management, Driver On-Board Management, Booking Management, and these systems possess multiple environments like Dev, Staging, and production that has respective subscriptions on every tenant as below

Considering the above scenario, there is no single place to manage and monitor all the subscriptions of multiple tenants. When there are multiple resources interacting with other resources in another tenant, it is not possible to group and manage all resources in a single place. Below are some common challenges that most of the Azure users would face with the Azure portal
- No Application Visibility
- No Consolidated Monitoring
- No Deep Integrated tooling
- No Application-level security
In this article, we will see how Serverless360 can solve the above challenges with the help of the Composite Application.
What is a Composite Application?
Manage your Azure resources from different Azure subscriptions and tenants in a logical container, Composite Application. User will get an Application-level view of your Azure Serverless business orchestration with the help of Composite Application
1.Logically group all your siloed entities that participate in your business solution into a Serverless Composite Application
2.Entities can be from different Azure Resource Groups, Azure Subscriptions, and Azure Regions
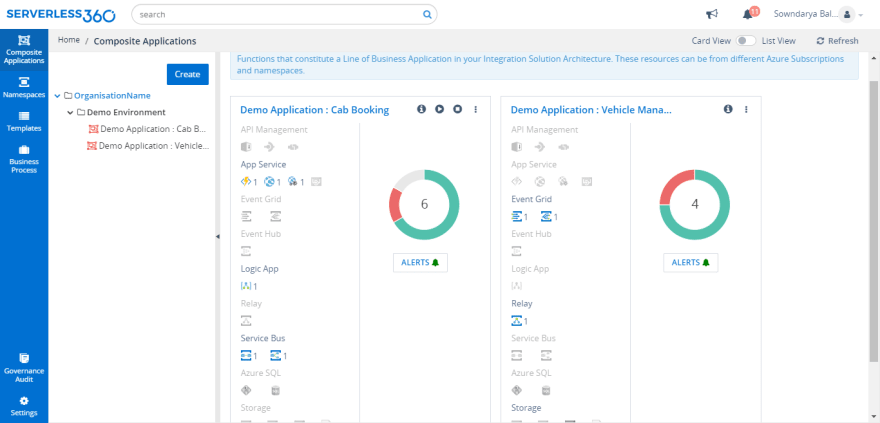
3.Access all your business orchestrations at one place, Composite Application dashboard.
4.This dashboard offers a comprehensive view of the current state of all entities that constitute business orchestrations.
5.Get immediate feedback on the entity status based on the configured monitors at the entity dashboard.
To make a connection between Composite Applications and Azure Subscriptions, Service Principal can be used in Serverless360. Service Principal is an Azure active directory application that requires a contributor level of access.

A Composite Application can have multiple dashboards. Each dashboard consisting of different types of customizable widgets which can be configured and arranged to meet the user need.
Providing Access to Azure Subscription
A Service Principal is an application within Azure Active Directory, which is authorized to access resources or resource groups in Azure. Serverless360 uses the authentication tokens of the Service Principal to manage the resources.
User can assign permissions to the Service Principal that are different than your own Azure account permissions. Typically, these permissions are restricted to exactly what Serverless360 can do.
User needs the following parameters to associate the Service Principal into Serverless360
To associate the Service Principal, user need to create the Service Principal
Steps to create Service Principals
1.Log in to the Azure portal and navigate to the “Azure Active Directory”-> App Registrations
2.Click on the “New registration” and create the Service Principal


Once the App is created, get Client ID, Subscription ID, Tenant ID, Client Secret to associate it to Serverless360.
To Authorize the Service Principal to Access the Resource Groups
1.Navigate to the “Subscriptions” and click on that.
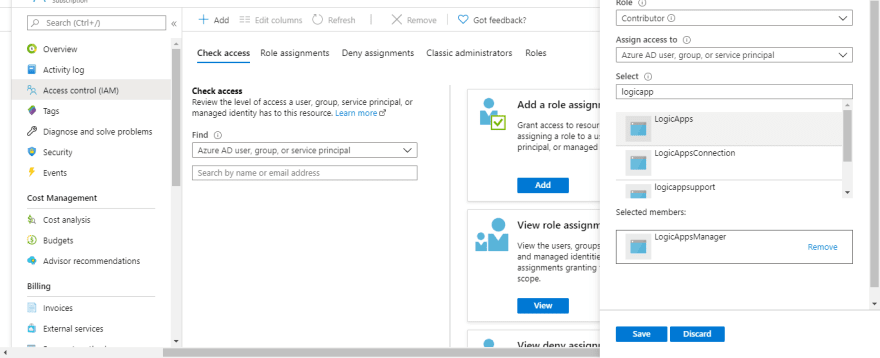
2.In the left panel find the “Access Control IAM” and click Add ->Add role Assignment.
3.Select the application created and click save.
Associating Service Principal into the Serverless360
Sign up into the Serverless360 and associate the Service principal on clicking the associate Service Principal
Enter the following credentials in Serverless360 and click save
1.Subscription Id
2.Tenant Id
3.Client Id
4.Client Secret

In the Service Principal section, the user can add multiple Service Principals of the same tenant or different tenants
Composite Applications
Once the Service Principal is associated, create the Composite Application to group all the resources of multiple subscriptions and tenants into a single container. Now users can leverage various operational and support capabilities offered by Composite Applications. Below described some of the key capabilities of Composite Applications.
Service Map
Service Map will help users visualize how the entities in a composite application relate to each other. This serves as a physical representation of the architecture, the user can derive relationships between the entities that constitute the composite application. It provides a clean dashboard with a full application view and displays the state of each entity based on its monitoring configuration.
Bring the Entities to the Board
In the service map section of the Composite Application, the entities associated with the Composite Application are listed on the left side menu. It is also possible to include a component that is not in the scope of Serverless360 but will be a part of the solution. The required entities can be selected from the left section (palette), which will add the representation of the entity in the right section (diagram pane).
Connect the Entities to Define the Flow
A connection can be made between the entities by clicking and dragging from the center of the representation
Save the Diagram
Once the diagram is saved, the entities will be displayed with the current monitoring status. Access detailed Error.
Edit If Required
The diagram can be edited by clicking the edit option. The issues list will not be displayed while in edit mode.

Infer Entity Status
Service Map indicates the health of the entity with the following color coding
1.Healthy- Green
2.Warning- Amber
3.Error- Red
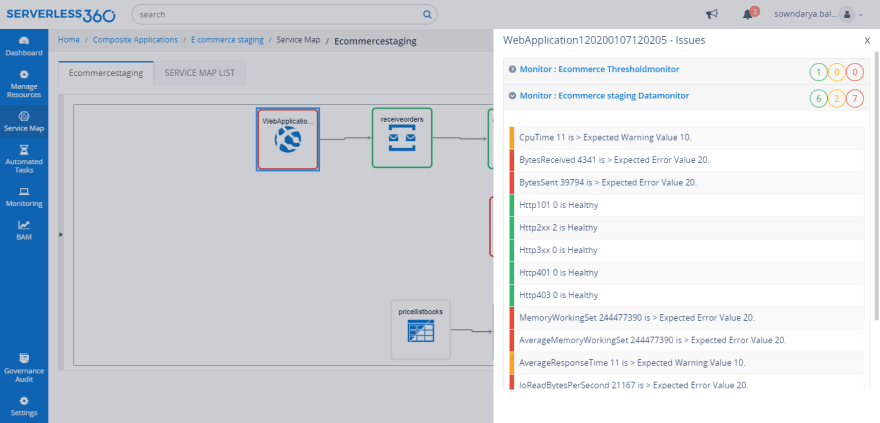
Click on the entity in warning or error state to fetch the details of the issue as below.
Serverless360 Live Dashboards
Dashboards in Serverless360 can be useful to know more about Azure resources in an application. With the variety of widgets available, users can analyze the azure resources on key metrics from various perspectives.
To know more about the Serverless360 dashboards

Monitoring Capability in Serverless360
Serverless360 helps the enterprises and offers an out of the box monitoring solution that assists the administrators to monitor the distributed azure services from different subscriptions and different tenant.
Types of Monitor
Threshold Monitor
The threshold monitor in Serverless360 sends immediate alerts based on the configuration whenever there is a violation. Users can also schedule the monitor based on the required day and time. Users can also limit the number of alerts to restrict spamming.
The threshold monitor also offers the auto-correct option that makes Azure services be always in an enabled state. Users can simply turn on the auto-correct option and configure the expected state. The threshold monitor will have an eye on the state and convert the state to the expected one if not. This auto healing capability enables the production resources to be always in an enabled state.
Autocorrect Alert Generated from serverless360 in Threshold monitor
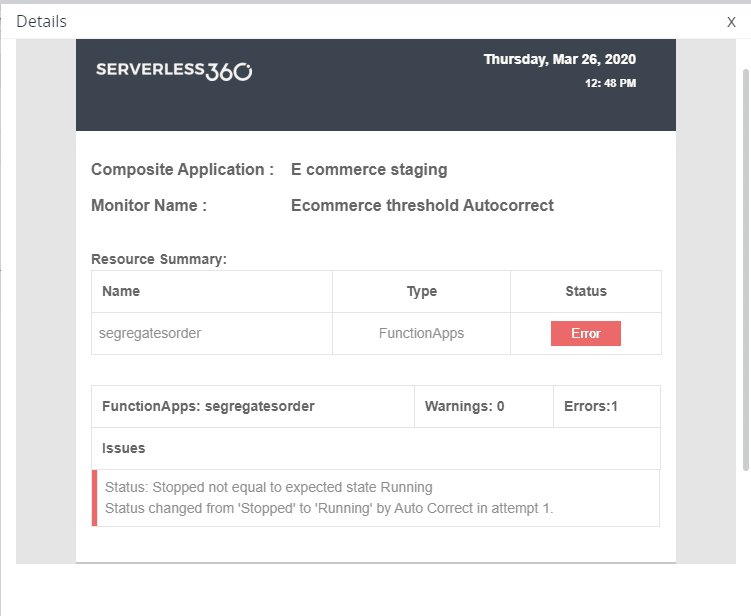
The above result is here the Function app state is not matched to the Expected state now the Function app state will be healthy and compliance alert will be generated by the threshold monitor.
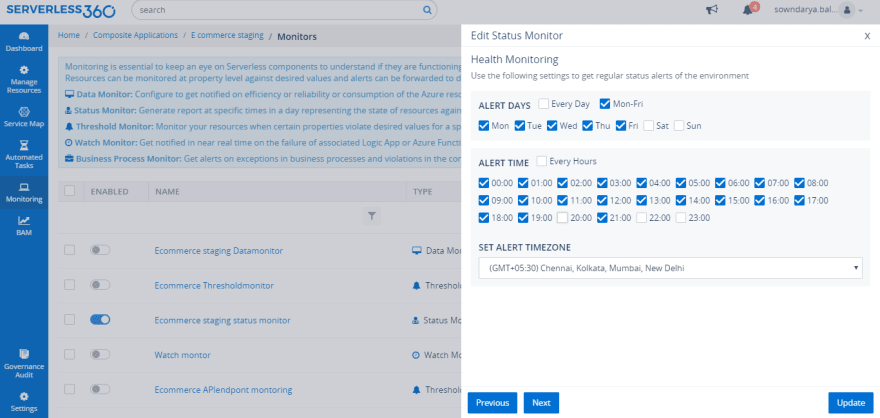
Status Monitor
Consider if the user needs a health report every two hours, they can create a status monitor and define the hours and notification channels. The status monitor can be configured to automate the daily health check by configuring the required hours.
Data Monitor
Data Monitor is a Performance monitor that offers an extensive set of metrics for every azure resource with which the performance, latency and memory consumptions can be monitored and alerted when there is a violation. Below are certain monitoring options that can be done with the help of a Data monitor.
1.Evaluate availability of Service Bus Queue / Topic by monitoring on a combination of metrics ‘Server Errors’, ‘User Errors’ and ‘Size’
2.Check on the efficiency of Service Bus Queue / Topic by verifying if you are processing the right number of messages in the specified time window hence ensuring that you meet your business requirements
3.Check on reliability of the Logic App by monitoring the number failed runs ‘Runs Failed’ every hour
4.Get alerted on the consumption of the Logic App, by monitoring if the ‘Total Billable Executions’ exceeds a certain volume, etc. This feature can be of help to Azure portal administrators to ease tasks that an administrator is forced to do on a daily basis, and it is a monotonous/repetitive task.
This feature can also be used by Azure developers to understand if the applications that interact with Azure Service Bus Queue / Topic handle them the right way, by monitoring the User Errors generated.

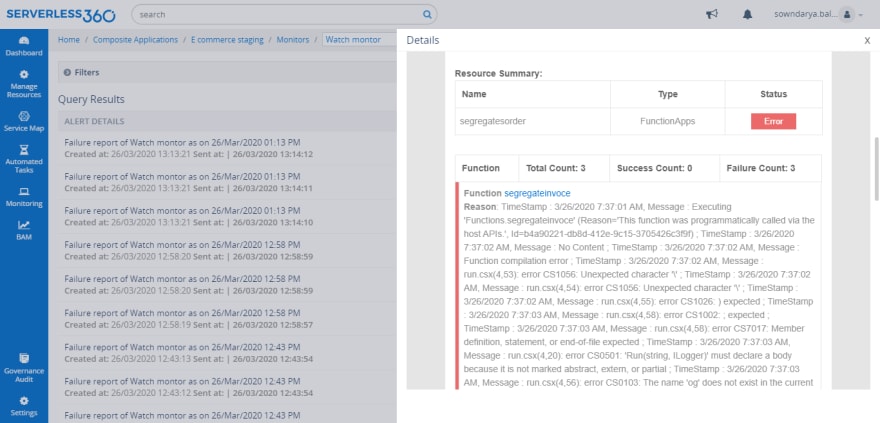
Watch Monitor
Consider a business orchestration where a Logic App and Function App play a critical role. Failure in the Logic App or Function App is not acceptable as it would bring the business process down. Serverless360 watch monitor can continuously monitor the Trigger and Run history of an associated Logic App and notify the failure reason through the configured notification channels. In the case of the Function App, the invocation Log will be investigated to identify a failure. Watch monitors proves to notify the failure in the orchestration within the configured minutes (between 5 and 15 mins) of its occurrence.
Conclusion
Using Serverless360 user can manage and monitor the multiple subscriptions across tenants in a single place and it also offers
1.Monitoring for Azure resources at the application-level.
2.Operational capabilities for developers to manage Azure resources.
3.Service Map to view whole orchestration that enables support person to identify the issue easily.
4.Dashboards for better analysis of the Azure resources.


Top comments (0)