I'm back dev. Today, I want to share you about a synthetic data that I was created a few day ago. I already upload it to kaggle which you can access here https://www.kaggle.com/datasets/saddamazyazy/go-to-college-dataset
The data was created using make_classification from sklearn package. But I did add a little touch of clustering to make categorical feature. So, basically this data has 2 label from 1000 rows with 11 columns. Here is the code!
X, y = make_classification(
    n_samples=1000,
    n_features=10,
    n_informative=8,
    random_state=42,
)
After that, I must look up correlation matrix to see how every variable correlate each other in a matrix.
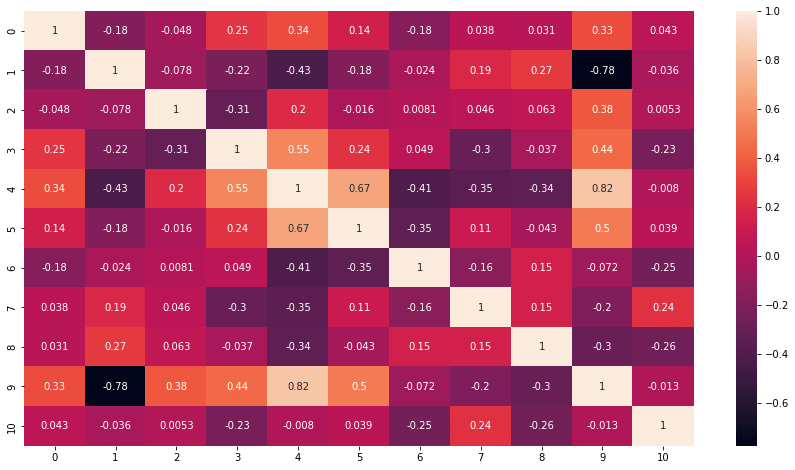
Some variables have positive or negative correlation, but some have none with value close to zero. With 10 variable I have to design a feature that match exactly based on research paper. To see whats correlate and whats not.
Based on those correlation, I can cluster some features with its label. This cluster usually in 2d. Due to underfitting, some cluster will not close with its true label. This is something that will give variation to data.
df['school_accreditation'] = KMeans(2, random_state=42).fit_predict(df[['school_accreditation', 'label']])
df['school_accreditation'] = df['school_accreditation'].replace({0: 'B', 1: 'A'})
I personally use K-Means to make cluster this number.


Top comments (0)