This article is about a fictional project that the story goes like this:
Image you are working at a tech company as a data scientist where you develop DS solutions for industries like e-commerce, IoT, manufacturing, etc.
One day, your company partners with a large manufacturing company collecting and storing gigabytes of sensory data each day. It is obvious that a relational database solution is not possible for them. However, instead of maintaining a distributed system like HDFS, they do a cost effective solution and use Amazon's S3.
In this scenario, let's say your job is to help them by building a predictive model that can determine if a machine would fail within the next 24 hours.
You built a poof of concept and tested it by working on a sample and realized that the models perform better when more historical data is used for training. Hence you need to train the models on a dataset that wouldn't fit on a single machine.
In this article, I will cover these topics to develop a solution for this exact problem:
- Setup a cluster with Spark using AWS EMR
- Data wrangling with PySpark on the cluster
- Distributed model training with PySpark's ML library
- Submit a Spark job to train the models in the EMR cluster
- Load the predictions back to S3
Github repo is here.
The Dataset
While there is the Amazon's open data registry that could be used for experimenting. I chose a very specific open dataset published by Fidan Boylu Uz from Microsoft, because I believe this dataset suits well to this exact problem of predictive maintenance.
If you would like to replicate the steps and practice it, please download the dataset first by using the download_dataset.sh here in this directory.
Download via:
cd src/data

sh download_dataset.sh
This dataset is composed of five "small" csv files and can be fit to a single machine. However, it will serve the basic structure for me to build the solution and I will be able to experiment on a small cluster (e.g. a cluster up to 4 nodes: 1 driver and 3 workers). I may consider this dataset as sample for development and test. Because Spark is awesome, if I build a working prototype on a single machine (local mode), I can easily scale it without changing my implementation.
Let's assume the manufacturing company saves the data in parquet format because they know it is faster to aggregate time series data with a columnar format. In a real-life project, I would expect see multiple records like all daily records being saved into one file at the end of the day. But I will not divide the records into multiple files in order to avoid the PUT and GET pricing of Amazon. I transform the csv files into parquet by running the transform.py in the same directory.
cd src/data

python transform.py
And now I see a new directory called records.
If you are willing to experiment further by running the code in a cluster, you will need to create a new S3 bucket and upload the records as I do it for myself:
aws s3 sync records s3://your-bucket-name
(Download sudo apt install awscli and configure.)
Please keep in mind, you will be charged for file transfers.
After the upload, I see five different parquet files in the bucket.
Example records stored in S3:
pdm_telemetry:
Row(datetime='2015-01-01 06:00:00', machineID=1, volt=176.217853015625, rotate=418.504078221616, pressure=113.07793546208299, vibration=45.0876857639276)

pdm_errors:
Row(datetime='2015-01-03 07:00:00', machineID=1, errorID='error1')

pdm_failures:
Row(datetime='2015-01-05 06:00:00', machineID=1, failure='comp4')

pdm_machines:
Row(machineID=1, model='model3', age=18)

pdm_maint:
Row(datetime='2014-06-01 06:00:00', machineID=1, comp='comp2')
I created another doc and added the details about each dataset here.
Creating Spark Cluster with AWS EMR
While it is possible to create a Spark cluster by creating multiple EC2 instances manually, the easier way is using the Amazon Elastic MapReduce (EMR) service. Here, using the EMR console is one option, however I prefer having a script file that I can use multiple times. I prepared a script file named emr.sh that I am using the awscli in it.
I can start a cluster simply by typing sh emr.sh in the terminal and the aws emr create-cluster command will be executed:
#!/bin/bash

# Specify the cluster name
CLUSTER_NAME=any-arbitrary-name

# Insert the IAM KEYNAME
# You get this key from AWS console's IAM section
KEY_NAME=your-key-name


# If you have not previously created the default Amazon EMR service role and EC2 instance profile,
# type `aws emr create-default-roles` to create them before typing the create-cluster subcommand.
aws emr create-cluster \
--name $CLUSTER_NAME \
--use-default-roles \
--release-label emr-5.31.0 \
--instance-count 4 \
--applications Name=Spark Name=Hadoop Name=Zeppelin Name=Livy \
--ec2-attributes KeyName=$KEY_NAME \
--instance-type m5.xlarge \
--bootstrap-actions Path="s3://your-actions-bucket/bootstrap.sh", \
Args=["instance.isMaster=true","echo running on driver node"]\
--auto-terminate
I can configure the number of clusters and the instance type from --instance-count and --instance-type arguments. --auto-terminate is an important one that terminates the cluster after the task finishes. Since I will connect to the cluster via ssh and submit the spark job manually, I will remove it - But please don't forget to terminate it afterwards, otherwise amazon will keep charging you!
--bootstrap-actions is useful when I want to run some setup commands while the cluster is being created. For example, I will upload a download script (s3://your-actions-bucket/bootstrap.sh) to another S3 bucket to use it for downloading my pyspark script (mlp.py) in the driver node. I will create these scripts later in this article and will use the emr.sh script after that.
Data Wrangling with PySpark
I am using a single python script to implement the data wrangling and the model training in the same place so that I can easily download this script to the EC2 driver node and submit a Spark job with it.
The first thing I need to do is creating a Spark session. A Spark session gives me the flexibility to use multiple Spark contexts in a unified way.
I create the session via the session builder:
from pyspark.sql import SparkSession

spark = SparkSession\
    .builder\
    .appName('PM Training')\
    .getOrCreate()
Here .getOrCreate() method activates the existing session or creates a new one.
Now that I have the session, I will load the datasets from my bucket.
telemetry_path = 's3a://your-bucket/PdM_telemetry.parquet'
failures_path = 's3a://your-bucket/PdM_failures.parquet'

failures = spark.read.parquet(failures_path)
telemetry = spark.read.parquet(telemetry_path)
I see sometimes the colleagues may not notice the difference and use
s3://...instead ofs3a://.... Please use thes3asince it is a much faster way to load the datasets from the buckets!Another fact is it is very important to have the s3 bucket in the same area with the cluster nodes (EC2 instances) or it will take some quite time to load the data from the distant S3 services.
Having the two datasets loaded, now I merge them together: telemetry and failures into merged. The telemetry contains the timestamp, machine id (there are 100 machines), and four sensor readings (volt, rotate, pressure, vibration) and the failures is the logging from four different failure events.
# create tables
telemetry.createOrReplaceTempView('telemetry')
failures.createOrReplaceTempView('failures')

# join telemetry and failures tables
spark.sql(
    """
    SELECT
      telemetry.datetime, telemetry.machineID, telemetry.volt,
      telemetry.rotate, telemetry.pressure, telemetry.vibration, failures.failure
    FROM telemetry
    LEFT JOIN failures
      ON telemetry.machineID = failures.machineID
      AND telemetry.datetime = failures.datetime
    """
).createOrReplaceTempView('merged')
Although I do have other datasets with additional information (like the machine types, maintenance time, errors, etc...), I won't use those features, since the aim of this article is to use Spark for distributed computing.
Now after the join, I see null valued failures when there is no failure at that particular time in the merged dataset. I will label the failure types and assign zero for the no-failure events.
# label encode
failure_dict = {
    'None': 0, 'comp1': 1,
    'comp2': 2, 'comp3': 3, 'comp4': 4
}
spark.udf.register('label_failure', lambda x: failure_dict[str(x)], T.IntegerType())

spark.sql(
    """
    SELECT *, label_failure(failure) as failure_lbl
    FROM merged
    """
).createOrReplaceTempView('merged')
I now have a new column failure_lbl with the integer labels indicating the different failure types. Since my aim is to accomplish the classification task: predicting if there will be a failure within the next 24 hours. I also need to do backfilling on labels with non-zero values:
# backfill any failure for the previous 24 hours
spark.sql(
    """
    SELECT *, MAX(failure_lbl)
    OVER
      (
        PARTITION BY machineID
        ORDER BY datetime ASC
        ROWS BETWEEN CURRENT ROW AND 24 FOLLOWING
      ) as label
    FROM merged
    """
).createOrReplaceTempView('merged')
After the backfilling the table looks like this (I didn't include all the fields for simplicity):
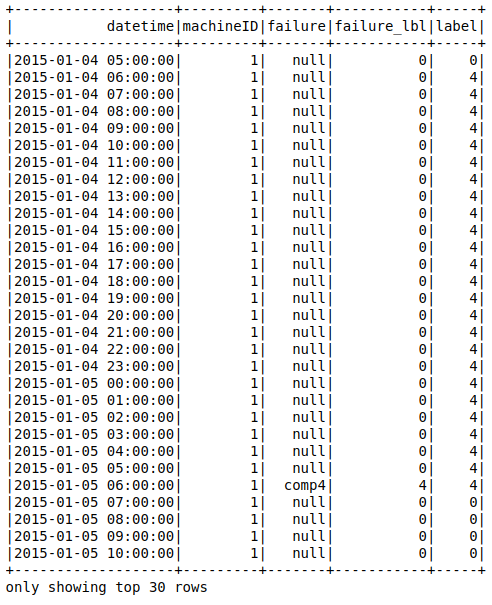
On the table above, the comp4 failure is labeled for the previous 24 hours. Now it is time to get the table as a data frame and prepare the ml pipeline.
# get the data frame
df = spark.sql(
    """
    SELECT datetime, machineID, volt, rotate, pressure, vibration, label
    FROM merged
    """
)
Dealing with Imbalanced Data
The non-failure events (label=0) are the majority in this task and I can't train a model with an imbalanced dataset. Here I will do undersampling to obtain a balanced data frame:
# label 0 is majority, apply undersampling
major = df.filter(df.label == 0)
minor = df.filter(df.label.isin([1, 2, 3, 4]))

ratio = (major.count() * 4.)/minor.count()
sampled_major = major.sample(False, 1/ratio)

balanced = sampled_major.unionAll(minor)
Model Training with PySpark ML
First, I apply persist for the balanced dataset. When the persisting (caching) applied, each node stores any partitions of it that it computes in memory and reuses them in other actions on that dataset which allows future actions to be much faster.
balanced.persist()
Then, I split the dataset before the pipeline steps:
train, test = balanced.randomSplit([0.8, 0.2], seed=42)
I do have two kinds of features here: the numerical features (sensor readings) and the categorical one (machineID). I start by normalizing the numerical features, then get the one-hot-encoded feature from machineID and combine them all into a single feature vector using the VectorAssembler.
# define the steps
num_assembler = VectorAssembler(
    inputCols=['volt', 'rotate', 'pressure', 'vibration'],
    outputCol='numericFeatures')

scaler = Normalizer(inputCol='numericFeatures', outputCol='numericFeaturesScaled')

encoder = OneHotEncoder(inputCol='machineID', outputCol='MachineIDOneHot')

assembler = VectorAssembler(
    inputCols=['MachineIDOneHot', 'numericFeaturesScaled'],
    outputCol='features')
Now I have my features prepared, the next step is to choose the model. I chose the multi-layer perceptron (mlp) since a deep learning model can keep increasing its performance as the dataset becomes larger. I will define the mlp structure and then will combine these transformers (stages) in a single pipeline.
# mlp
layers = [104, 256, 5]
mlp = MultilayerPerceptronClassifier(maxIter=200, layers=layers, seed=42)

# create the pipeline
pipeline = Pipeline(stages=[num_assembler, scaler, encoder, assembler, mlp])
Once I created my pipeline, I can use it to train the model and evaluate the test set. Spark will do the training on the worker nodes and predict the test set by including the probabilities and the predictions into the test data frame.
# train and get the model
model = pipeline.fit(train)

# test set inference
result = model.transform(test)

# eval
evaluator = MulticlassClassificationEvaluator()
f1 = evaluator.evaluate(result)
print(f'Test score: {f1}')
Saving the Predictions to S3
I created my model, predicted the test set and got back the predictions in the result data frame. Now I want to save the results so me or my colleagues can access it in the future. I want to save it in the best possible way so reading the results on a particular date becomes mush easier. I accomplish it by partitioning the results by the year, month, and day when saving. I will first create the year, month, and day columns from the timestamp and save the result by using their partitions.
# save the results
# create year, month, and day columns for the partitioning
result = result\
    .withColumn('year', F.year('datetime'))\
    .withColumn('month', F.month('datetime'))\
    .withColumn('day', F.dayofmonth('datetime'))

# save the results
result.select(
    'datetime', 'year', 'month', 'day',
    'machineID', 'prediction')\
    .write\
    .mode('overwrite')\
    .option('header', True)\
    .partitionBy('year', 'month', 'day')\
    .csv('s3a://your-another-bucket/data/partitions/data.csv')
Sor far, I loaded the datasets, joined them together, did some data wrangling and applied undersampling, created my model and predicted the results! As the final step, I will stop the Spark, because this is batch processing rather than a streaming job.
spark.stop()
Prepare the Bootstrap and Run
I want my emr script (emr.sh) automatically do the cluster creation and download my pyspark script (mlp.py) in the driver node. So I upload the mlp.py file to another S3 bucket along with my bootstrap script (bootstrap.sh) which will download the mlp.py file in the cluster creation step. My bootstrap file contains a simple download command:
#!/bin/bash

aws s3 cp s3://your-actions-bucket/mlp.py ~/
Having the bootstrap file ready, I can now modify and use the emr.sh file to start the cluster: sh emr.sh. Then I can connect to the driver node via ssh and check for the mlp.py file in the home directory ls -lah ~/.
I see that all the clusters are running successfully, and my mlp.py file is there in the home directory. I can now submit the spark job and run my mlp.py script:
/usr/bin/spark-submit --master yarn ./mlp.py
I monitor the steps and after the job finishes, I see my result data frame is now saved to the S3 bucket successfully!
Summary
In this work, I assumed that the model performance becomes better with a larger training set and the training set doesn't fit into a single machine for data processing and model training. Although there is a great potential for feature engineering by using the rest of the three datasets, I didn't want to go into a detailed feature engineering since the main goal was to discover the Spark functionalities and accomplish a distributed computing.
This project was a fictional one, however very close to a real world scenario. The difference is the dataset I used can fit into a single machine, so I treated this dataset as a sample from a large population. I started implementing the pipelines on local mode then sent it to EMR cluster and tested. It is now possible to run the same computation on big data by just changing the S3 urls. When transitioning from sample to population, the most common issue is imbalanced RDDs. An imbalanced RDD means one of the worker nodes gets a very large portion of the dataset while others having small partitions. This causes a slow down in the process and can be tracked by monitoring the workers via the Spark web UI. There are multiple ways to overcome this issue (e.g. applying repartition) which can be a good reason for another article.

Top comments (0)