
The pitch
Unify logs, metrics, traces, and more in a scalable stack that's free, open, and built for speed. Monitor every element in your infrastructure to quickly resolve issues and consistently deliver exceptional digital experiences.

Elasticsearch
Elasticsearch is a distributed, RESTful search and analytics engine capable of addressing a growing number of use cases. As the heart of the Elastic Stack, it centrally stores your data for lightning fast search, fine‑tuned relevancy, and powerful analytics that scale with ease.
# Import GPG key
wget -qO - https://artifacts.elastic.co/GPG-KEY-elasticsearch | sudo apt-key add -

# Install apt-transport-https
sudo apt-get install apt-transport-https

# Add repository to sources.list
echo "deb https://artifacts.elastic.co/packages/7.x/apt stable main" | \
  sudo tee /etc/apt/sources.list.d/elastic-7.x.list

# Install Elasticsearch
sudo apt-get update && sudo apt-get install elasticsearch

# Start the Elasticsearch service
sudo service elasticsearch start

# Verify that it's running
curl localhost:9200
# {
#   "name" : "parrot",
#   "cluster_name" : "elasticsearch",
#   "cluster_uuid" : "dYmxXrrJSIqF24FE7UcO7A",
#   "version" : {
#     "number" : "7.9.2",
#     "build_flavor" : "default",
#     "build_type" : "deb",
#     "build_hash" : "d34da0ea4a966c4e49417f2da2f244e3e97b4e6e",
#     "build_date" : "2020-09-23T00:45:33.626720Z",
#     "build_snapshot" : false,
#     "lucene_version" : "8.6.2",
#     "minimum_wire_compatibility_version" : "6.8.0",
#     "minimum_index_compatibility_version" : "6.0.0-beta1"
#   },
#   "tagline" : "You Know, for Search"
# }
Kibana
Kibana is a free and open user interface that lets you visualize your Elasticsearch data and navigate the Elastic Stack. Do anything from tracking query load to understanding the way requests flow through your apps.
# Install kibana
sudo apt install kibana
To verify that Kibana is running, head over to localhost:5601. You should be able to see the dashboard right in your web-browser.
Actual monitoring
Metricbeat
Collect metrics from your systems and services. From CPU to memory, Redis to NGINX, and much more, Metricbeat is a lightweight way to send system and service statistics.


# Install metricbeat
sudo apt install metricbeat

# Start the service
sudo service start metricbeat
Heartbeat
Monitor services for their availability with active probing. Given a list of URLs, Heartbeat asks the simple question: Are you alive? Heartbeat ships this information and response time to the rest of the Elastic Stack for further analysis.

# Install heartbeat
sudo apt install heartbeat-elastic

# Start the service
sudo service start heartbeat-elastic
Filebeat
Forget using SSH when you have tens, hundreds, or even thousands of servers, virtual machines, and containers generating logs. Filebeat helps you keep the simple things simple by offering a lightweight way to forward and centralize logs and files.
# Installation
sudo apt install filebeat

# Configuration
sudo vim /etc/filebeat/filebeat.yml
In the /etc/filebeat/filebeat.yml go to the filebeat.inputs section and set enabled to `true.
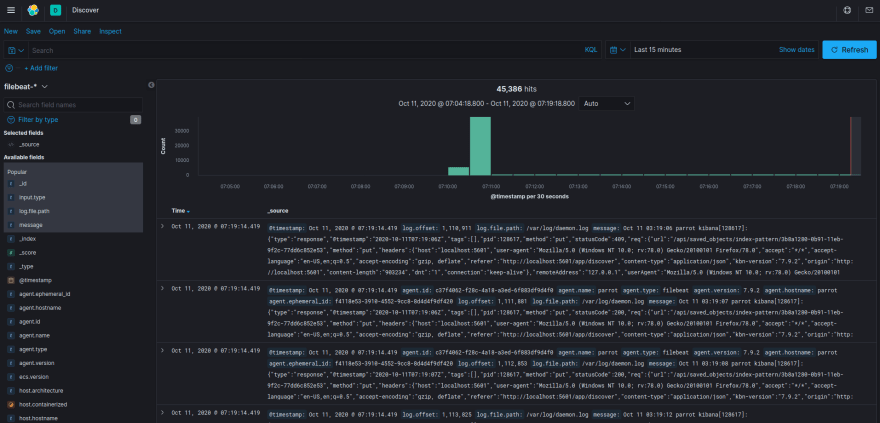
The last step to get Filebeat up and running is to configure an "index pattern". To do this head over to localhost:5601 and follow these instructions:
- Go to left-menu
- Click on Discover
- Create index pattern
- In index pattern name: Write
filebeat-* - Click on create index pattern
- Same text box: Write
filebeat-* - Click on Next Step
- Select
@timestampas Time Field - Click on Create index pattern

Top comments (0)