Yes, just as you read it in the title. I'm going to show you how to send your Elixir telemetry data to Prometheus.
First, let's recapitulate. In the previous article, I showed you how to create an Elixir Metrics Reporter to do the aggregation of your telemetry data and convert it to meaningful metrics.
Now I am going to show you how to use the telemetry_metrics_prometheus library to expose this data so that Prometheus can retrieve it and process it.
Prerequisites
We are going to use the repo we did for the previous article. Clone it from here.
Install the telemetry_metrics_prometheus library
Add the telemetry_metrics_prometheus to your mix.exs dependencies.
  defp deps do
    [
      {:telemetry, "~> 1.0"},
      {:telemetry_metrics, "~> 0.6.1"},
      {:telemetry_metrics_prometheus, "~> 1.1.0"}
    ]
  end
Then get the new dependency:
mix deps.get
Configuring the Prometheus reporter
Now we need to add the reporter to telemetry.ex. Change the init/1 function to this:
  def init(_arg) do
    children = [
      {TelemetryMetricsPrometheus, metrics: metrics()},
      {Metrics.Telemetry.CustomReporter, metrics: metrics()}
    ]

    Supervisor.init(children, strategy: :one_for_one)
  end
And that should be all we need to do.
Unfortunately, it is not. The current version of the library doesn't allow several metrics to have the same metric name. Right now, we have this:
  defp metrics do
    [
      counter("metrics.emit.value"),
      sum("metrics.emit.value")
    ]
  end
We need to use different metric names but still handle the same events. We can take advantage of the second parameter to the metric functions that allow us to be explicit about events and measurements. Let's change it to this:
  defp metrics do
    [
      counter("metrics.emit.value.counter", event_name: [:metrics, :emit], measurement: :value),
      sum("metrics.emit.value.sum", event_name: [:metrics, :emit], measurement: :value)
    ]
  end
You can see that now the metric names are different but the event names and measurements are correct. With this, telemetry_metrics_prometheus will work correctly.
Testing the metrics generated
The Prometheus library includes a web server that exposes a /metrics endpoint on port 9568. We can use it to check the metrics collected by Prometheus. Let's try it. Start your app with iex:
iex -S mix
and go to http://localhost:9568/metrics
And you'll see an empty page. Disappointing. But that's because we haven't yet generated any event.
Let's emit some events. In your just opened iex session write this:
iex -S mix
iex(1)> 1..100 |> Enum.each(&Metrics.emit(&1))
Metric: Elixir.Telemetry.Metrics.Counter. Current value: {1, 0}
Metric: Elixir.Telemetry.Metrics.Sum. Current value: {1, 1}
...
Metric: Elixir.Telemetry.Metrics.Counter. Current value: {100, 4950}
Metric: Elixir.Telemetry.Metrics.Sum. Current value: {100, 5050}
:ok
iex(2)>
As you can see, I am emitting 100 events, with values from 1 to 100. As we have count and a sum metrics defined, we should get the count of events (100) and the sum of all those events (the sum from values from 1 to 100 is 5050).
From the iex output, at least we can affirm that our CustomReporter works. What about the Prometheus reporter?
Go again to http://localhost:9568/metrics and you'll see this:
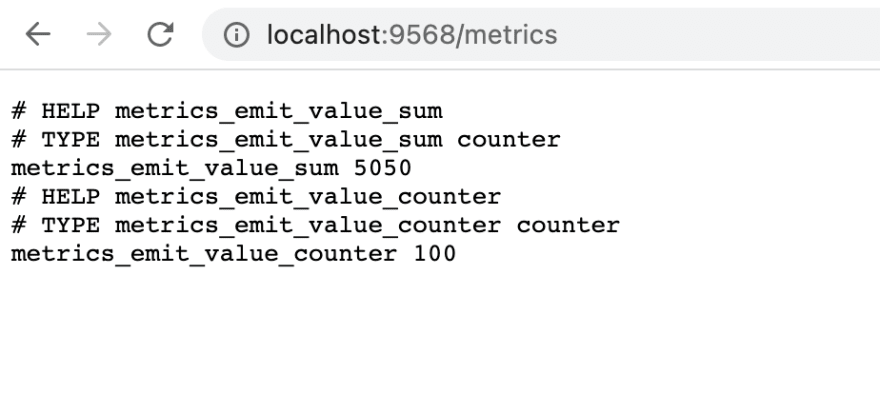
Yay, the output of the /metrics endpoint is correctly counting and adding the values we emit with our events. Good.
We now need Prometheus to ingest this information. So far, our app is only exposing that endpoint but if nobody access it, is not really useful.
Install Prometheus
Let's install Prometheus. You can go to the prometheus page and follow the install instructions. Or, if you are in mac, use brew to install it.
For this tutorial, I am assuming you used brew.
brew install prometheus
This will install it locally and you can either start it manually or as a service. But first, we need to configure it.
The output of brew install will show where the configuration files are. You should see messages similar to these:
==> Caveats
When run from `brew services`, `prometheus` is run from
`prometheus_brew_services` and uses the flags in:
   /usr/local/etc/prometheus.args

To restart prometheus after an upgrade:
  brew services restart prometheus
Or, if you don't want/need a background service you can just run:
  /usr/local/opt/prometheus/bin/prometheus_brew_services
Be sure to look at that output to know where it is. On my laptop, the config file is in /usr/local/etc/prometheus.yml
Open it and add a new section for our elixir app:
global:
  scrape_interval: 15s

scrape_configs:
  - job_name: "prometheus"
    static_configs:
    - targets: ["localhost:9090"]
  - job_name: "telemetry_metrics_prometheus"
    static_configs:
    - targets: ["localhost:9568"]
I only added the last job_name named "telemetry_metrics_prometheus". You can see that I specified the 9568 port and left out the /metrics part. Prometheus by default tries to access the /metrics endpoint of the target.
Save it and now we can start the Prometheus server:
brew services restart prometheus
Stopping `prometheus`... (might take a while)
==> Successfully stopped `prometheus` (label: homebrew.mxcl.prometheus)
==> Successfully started `prometheus` (label: homebrew.mxcl.prometheus)
Prometheus runs on port 9090 so open http://localhost:9090/ and you'll see something like this:

Not much to see yet, but that's because we haven't specified what metric we want to see. If you remember the metrics we expose on /metrics have the names metrics_emit_value_sum and metrics_emit_value_counter. Let's use metrics_emit_value_sum to see the values Prometheus scrapped from our Elixir app. Put it in the "Expression" input field and click on the "Execute" button.

You'll see now the last value Prometheus scrapped from our Elixir app:

Nice. If you go to the graph tab you'll see the value too.

As we only have a single data point, we see a simple horizontal line. Let's add more values, but let's wait 15 seconds between each one (that's the interval Prometheus waits between scraps).
1..80 |> Enum.each(&Metrics.emit(&1))
1..110 |> Enum.each(&Metrics.emit(&1))
1..50 |> Enum.each(&Metrics.emit(&1))
1..170 |> Enum.each(&Metrics.emit(&1))
After that, if you refresh the graph, you'll see something like this:

That's it. Prometheus is now scraping the values from the /metrics endpoint in our Elixir application.
What's next
There is a lot more to explore from here. You could for example integrate with Grafana to create stunning dashboards for your metrics. If you go that way, don't forget to take a look at the prom_ex library, because it automates exposing your Prometheus data and creating Grafana dashboards on application start.
Summary
We learned:
- what the
telemetry_metrics_prometheuslibrary is - how to scrap our metrics with
Prometheus
Source code
You can find the source code for this article in this GitHub repository. Check the metrics-prometheusbranch.
About
I'm Miguel Cobá. I write about Elixir, Elm, Software Development, and eBook writing.
- Follow me on Twitter
- Subscribe to my newsletter
- Read all my articles on my blog
- Get my books:

Latest comments (2)
Great article. Thanks for this!
I'm glad you liked it, Jonathan!