
Intro to Machine Learning. (For complete beginners)
This post is for those who are interested in obtaining a general overview of machine learning. Let's get started.
What is Machine Learning?
Making a computer learn by analyzing data and statistics is known as machine learning. It enables software programs to predict outcomes more accurately without having to be expressly designed to do so. In order to forecast new output values, machine learning algorithms use historical data as input. The more data is fed, the program predicts more accurately. Let's make it easier. Suppose you are teaching a child what is a fish. You show multiple pictures of different fishes and mention characteristics of them. So whenever they see a new entity with similar characteristics their immediately register that entity as a fish. We use the same technique to teach a computer what is a fish. We provide it with images of different fishes. It is called Training Data. Computers recognizes all the characteristics of these pictures and stored into its memory as Fish. Now if we give it a new image of a fish to predict what it is, it provides a prediction based on the Training Data. The new image is called Test Data. In order to predicting something a computer requires training data as input and based on the the Test Data we get the prediction either it's a fish or not.

Application of Machine Learning
We already utilize machine learning, and you might not be aware of how it affects your life. Here are a few applications you should be aware of:
Features of social media: Machine learning algorithms are incorporated into social media platforms to assist you receive customized experiences. Facebook keeps track of all of your activity, including comments, likes, and the amount of time you spend on various types of content. Based on your activity, the system suggests pages and friends that are personalized for you.
Virtual assistants: If you're looking for a virtual personal assistant, popular choices include Apple's Siri, Amazon's Alexa, and Google Now. These voice-activated gadgets can accomplish a variety of things, such look up flight information, check your schedule, set alarms, and more. The main feature of these smart speakers and devices is machine learning. Each time you engage with them, they gather and improve the knowledge they have. The computer can utilize that information to deliver results that are most closely aligned to your preferences.
Product recommendations are a prominent use of machine learning that are popular on e-commerce platforms. In order to propose and recommend things you might be interested in, these websites are able to track your behavior based on your searches, past transactions, and shopping cart history.
Image recognition is becoming increasingly common in a wide range of industries. You've probably seen this in the course of your daily life while posting a photo on social media. The software can identify someone you tag in a photograph. It may also be incredibly useful for tracking down missing people, unlocking phones and other mobile devices, and spotting potential thieves or dangers.
Real-life implementation
Let's build a Machine learning model with real data. First. how do we do it? There are seven core steps:
- Import Data: First we import our dataset on which we are going to build our project. We
- Clean Data: We remove null values, unnecessary columns and duplicates for precise prediction.
- Split the data into Training/Test Sets
- Algorithm: Select a machine learing algorithm to analize the data. (eg. Decision Tress)
- Train the model
- Make predictions
- Evaluate and Improve
Tools
Below tools will be necessary for our first project
- Jupyter-Notebook: Best for Data-Analysis
- Numpy: Provides multi-dimensional array
- Pandas: Python library built on Numpy to analyze data effectively
- Matlotlib: Python Library for making graphs and plots
- Scikit-Learn: Popular Machine Learning library that provides all common machine learning algorithms
Music Recommendation according to customers' likings

Here we have a dataset of an exceptionally popular music streaming platform names Musify. We are going to predict which music albums these users are likely to buy according to their profiles (Data collected)
You can download it here: Link
Importing our data
We import all the libraries first and for the ease of your use you can use Kaggle
import numpy as np
import pandas as pd
import matplotlib.pyplot as plt
from sklearn.preprocessing import StandardScaler
import warnings
warnings.filterwarnings('ignore')
%matplotlib inline

#Only applicable for kaggle.
import os
for dirname, _, filenames in os.walk('/kaggle/input'):
    for filename in filenames:
        print(os.path.join(dirname, filename))
Working with the data
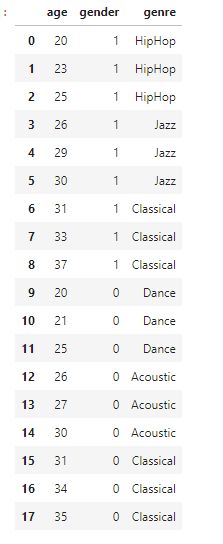
As we are now set with the environment now we are going to import and analyze our data with Pandas. First Let's see what's inside our dataset. We can easily view our dataset through Pandas library's read_csv method. (eg. pd.read_csv('FILE_NAME.csv))
df = pd.read_csv('../input/musicpredicts/music.csv') # importing our dataset
df #viewing our data set
Here we imported our data in df variable. we can write df and press enter to get the below output.
Clean data
We are done with importing our data. Now we clean our data. Cleaning means we remove empty cells, irrelevant data, duplicates, null values etc. Let's get into it!
Note: We don't have any null values here so we don't remove anything.
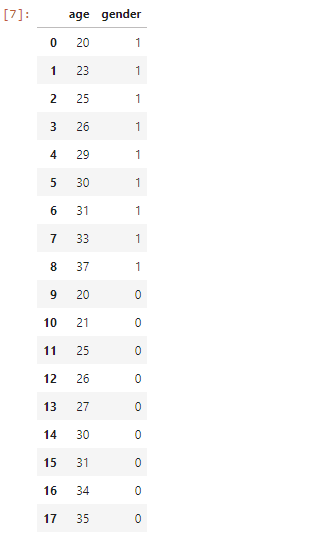
Now we split our input dataset X. And our output dataset. Here we don't want genre as our input but output. We drop the column genre with .drop() method.
X = df.drop(columns=['genre'])
X #Its the input
We get the below output which is without genre. But didn't drop genre from the main data frame.
If we place our cursor in drop we can see how we can use this method.

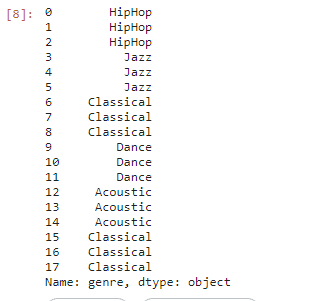
We create another variable y which only has the genre and it will be our output
y = df['genre']
y # it will be the output
Making predictions
Now we have our output dataset stored in y. Let's train our model. As said earlier we will use Scikit-Learn for implementing our Machine Learning Algorithm In order to having good accuracy, We are going to use Scikit learn's Decision Tree Classifier
#import scikit learn
from sklearn.tree import DecisionTreeClassifier
from sklearn.model_selection import train_test_split
model = DecisionTreeClassifier() #We call the object
model.fit(X,y) #This is how we teach the object patterns of our dataset.
predictions = model.predict([ [ 21,1 ] , [ 22,0 ] ])
#Let's test our predictions of what 21 years old male and 22 years old female likes. Both are missing from our dataset
predictions
Let's break it down. Fist we call the method, the we teach patterns our dataset has with .fit(INPUT,OUTPUT). After providing a dummy data which is missing from dataset we get this output
array(['HipHop', 'Dance'], dtype=object)
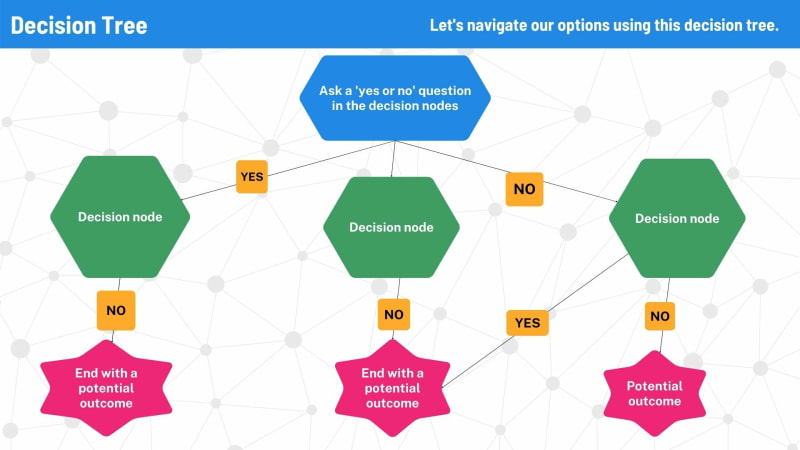
So 21 years old males like HipHop and 22 years old females like Dance. Let's see what is actually decision tree. Decision Tree is the most powerful and popular tool for classification and prediction. A Decision tree is a flowchart-like tree structure, where each internal node denotes a test on an attribute, each branch represents an outcome of the test, and each leaf node (terminal node) holds a class label. In a Decision tree, there are two nodes, which are the Decision Node and Leaf Node. Decision nodes are used to make any decision and have multiple branches, whereas Leaf nodes are the output of those decisions and do not contain any further branches. The decisions or the test are performed on the basis of features of the given dataset.It is called a decision tree because, similar to a tree, it starts with the root node, which expands on further branches and constructs a tree-like structure.
Pros and Cons of using a decision tree
Pros
- Decision trees are able to generate understandable rules
- Decision trees perform classification without requiring much computation.
- Decision trees are able to handle both continuous and categorical variables.
- Decision trees provide a clear indication of which fields are most important for prediction or classification.
Cons
- Decision trees are less appropriate for estimation tasks where the goal is to predict the value of a continuous attribute.
- Decision trees are prone to errors in classification problems with many classes and a relatively small number of training examples.
- Decision tree can be computationally expensive to train. The process of growing a decision tree is computationally expensive. At each node, each candidate splitting field must be sorted before its best split can be found. In some algorithms, combinations of fields are used and a search must be made for optimal combining weights. Pruning algorithms can also be expensive since many candidate sub-trees must be formed and compared.
Now let's measure the accuracy
We split our datasets into two sets Training and Testing. Rule of thumb: We allocate 80% of our data for Training and 20% of our data for testing. We have already imported a function called train_test_split. It returns a tuple so we split our tests and train datasets like the code below.
X_train, X_test, y_train, y_test = train_test_split(X,y,test_size=0.2)
First two variables are input training and testing sets and last two are output training and testing datasets. We are allocating 20% of our data as test data with test_size=0.2 attribute in train_test_split function
model.fit(X_train,y_train)
predictions = model.predict(X_test)
Let's calculate the accuracy
from sklearn.metrics import accuracy_score
#Now let's measure the accuracy
score = accuracy_score(y_test,predictions)
score
1.0
We have an accuracy of 100 percent! But it picks data randomly so everytime we run this cell we get different results. For a dataset which has a few data. It's tough for a computer to predict something very accurately. The more data, the more accurate, As simple as that.
Making your model more precise
Our model is too weak. So we go back where we have started. And make it more efficienct. How? We will create a new trained model and everytime we make a prediction we use that trained model. Let's code.
import joblib
model.fit(X,y)
joblib.dump(model,'music-recommender.joblib')
['music-recommender.joblib']
Now we use that file everytime we predict something. In real life we don't have to train our data again and again. Now we predict new data with already trained model.
#import scikit learn
from sklearn.tree import DecisionTreeClassifier
from sklearn.model_selection import train_test_split
'''
Comment out everything and load the trained model
'''
# model = DecisionTreeClassifier() #We call the object
# model.fit(X,y) #This is how we teach the object patterns of our dataset.
#Load the trained model
model = joblib.load('music-recommender.joblib')
#Let's see if it works
predictions = model.predict([ [ 21,1 ] ])
#Let's test our predictions of what 21 years old male and 22 years old female likes. Both are missing from our dataset
predictions
array(['HipHop'], dtype=object)
It WORKS! NOW we will visually understand how decision tree actually make predictions.
Data Visualization
Let's visualize the data to get a visual presentation of how decision tree is working.
#import scikit learn
from sklearn.tree import DecisionTreeClassifier
from sklearn.model_selection import train_test_split
from sklearn import tree
model = DecisionTreeClassifier() #We call the object
model.fit(X,y) #This is how we teach the object patterns of our dataset.
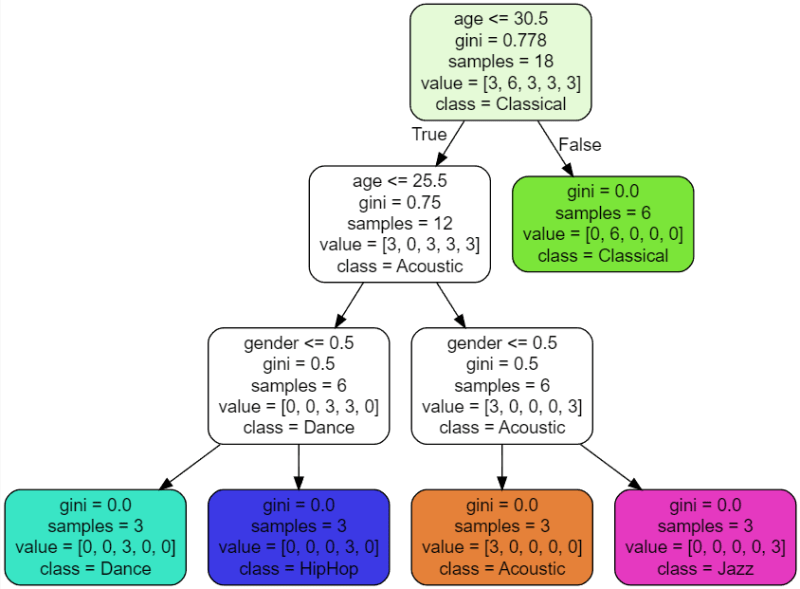
tree.export_graphviz(model,out_file='music_recommender.dot',feature_names=['age','gender'],class_names=sorted(y.unique()),label = 'all', rounded = True,filled=True)
Below file has been generated. Now we don't need to train our model again.
music_recommender.dot
Now let's open the file in VSCode. Download Graphviz (dot) language support for Visual Studio Code v0.0.6 extension. And we get the graph below. That's how decision trees work.
And now Good luck and enjoy learning how to make machines smart! Good vibes only

Top comments (0)