And what we did about it
Meadowrun is a no-ceremony tool to run your Python code in the cloud that automates the boring stuff for you.
Meadowrun checks if suitable EC2 machines are already running, and starts some if not; it packages up code and environments; logs into the EC2 machine via SSH and runs your code; and finally, gets the results back, as well as logs and output.

This can take between a few seconds in the warmest of warm starts to several minutes in the coldest start. For a warm start, a machine is already running, we have a container already built and local code is uploaded to S3. During a cold start, all these things need to happen before you get to see your Python code actually run.
Nobody likes waiting, so we were keen to improve the wait time. This is the story of what we discovered along the way.
You don’t know what you don’t measure
At the risk of sounding like a billboard for telemetry services, the first rule when you’re trying to optimize something is: measure where you’re spending time.
It sounds absolutely trivial, but if I had a dollar for every time I didn’t follow my own advice, I’d have…well, at least 10 dollars.
If you’re optimizing a process that just runs locally, and has just one thread, this is all pretty easy to do, and there are various tools for it:
- log timings
- attach a debugger and break once in a while
- profiling
Most people jump straight to profiling, but personally I like the hands-on approaches especially in cases where whatever it is you’re optimizing has a long total runtime.
In any case, measuring what Meadowrun does is a bit more tricky. First, it starts processes on remote machines. Ideally, we’d have some kind of overview where activities running on one machine that start activities on another machine are linked appropriately.
Second, much of meadowrun’s activity consists of calls to AWS APIs, connection requests or other types of I/O.
Because of both these reasons, meadowrun is not particularly well-suited to profiling. So we’re left with print statements—but surely something better must exist already?
Indeed it does. After some research online, I came across Eliot, a library that allows you to log what it calls actions. Crucially, actions have a beginning and end, and Eliot keeps track of which actions are part of other, higher-level actions. Additionally, it can do this across async, thread and process boundaries.
The way it works is pretty simple: you can annotate functions or methods with a decorator which turns it into an Eliot-tracked action. For finer-grained actions, you can also put any code block into a context manager.
@eliot.log_call
def choose_instances():
    ...
    with eliot.start_action(action_type="subaction of choose"):
        ...
To make this work across processes, you also need to pass an Eliot identifier to the other process, and put it in context there—just two extra lines of code.
# parent process
task_id = eliot.current_action().serialize_task_id()

# child process receives task_id somehow,
# e.g. via a command line argument
eliot.Action.continue_task(task_id=task_id)
After adding the Eliot actions, Eliot logs information to a JSON file. You can then visualize it using a handy command line program called eliot-tree. Here’s the result of eliot-tree showing what Meadowrun does when calling run_function:
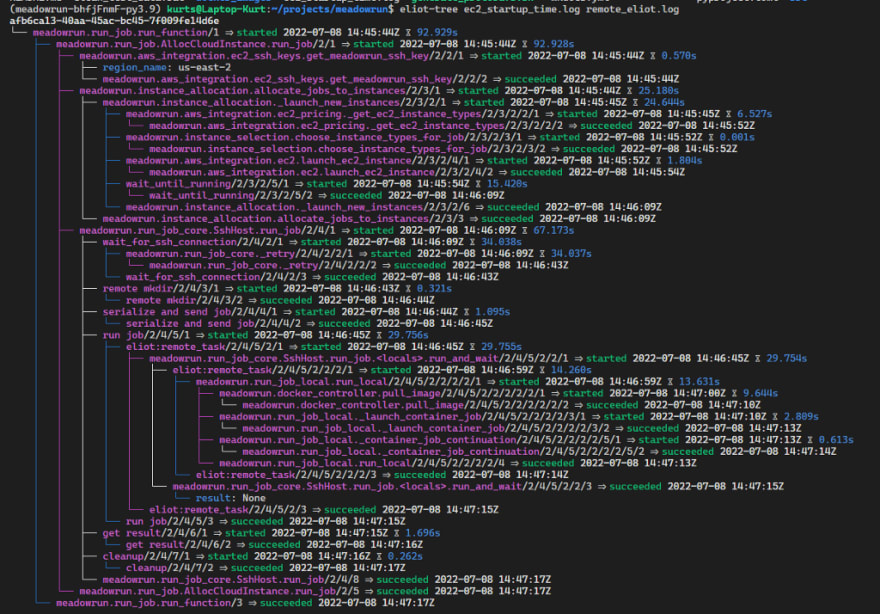
This is a great breakdown of how long everything takes, that pretty much directly led to all the investigations we’re about to discuss. For example, the whole run took 93 seconds, of which the job itself used only a handful of seconds—this was for a cold start situation. In this instance, it took about 15 seconds for AWS to report that our new instance is running and got an IP address (wait_until_running) but then we had to wait another 34 seconds before we could actually SSH into the machine (wait_for_ssh_connection).
Based on Eliot’s measurements, we tried to make improvements in a number of areas (but didn’t always succeed!).
Cache all the things some of the time
One of the quickest wins: meadowrun was downloading EC2 instance prices before every run. In practice spot and on-demand prices don’t change frequently:
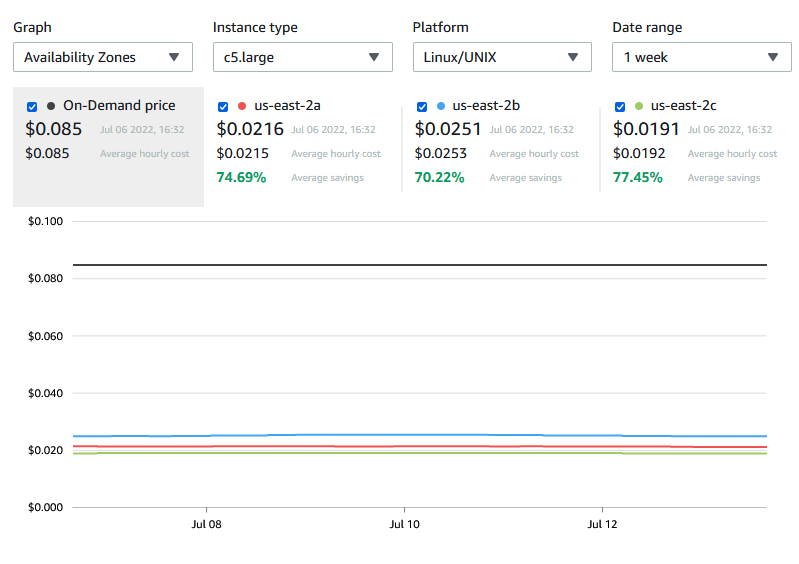
So it’s more reasonable to cache the download locally for up to 4 hours. That saves us 5–10 seconds on every run.
All Linuxes are fast but some are faster than others
We can’t influence how long it takes for AWS to start a virtual machine, but perhaps some Linux distributions are faster to start than others—in particular it’d be nice if they’d start sshd sooner rather than later. That potentially cuts down on waiting for the ssh connection.
Meadowrun is currently using an Ubuntu-based image, which according to our measurements takes about 30–40 seconds from the time when AWS says the machine is running, to when we can actually ssh into it. (This was measured while running from London to Ohio/us-east-2—if you run Meadowrun closer to home you’ll see better times.)
In any case, according to EC2 boot time benchmarking, some of which we independently verified, Clear Linux is the clear winner here. This is borne out in practice, reducing the “wait until ssh” time from 10 seconds to a couple when connecting to a close region, and from 30 seconds to 5 seconds when connecting across the Atlantic.
Despite these results, so far we’ve not been able to switch Meadowrun to use Clear Linux—first it took a long time before we figured out how to configure Clear so that it picks up the AWS user-data. At the moment we’re struggling with installing Nvidia drivers on it, which is important for machine learning workloads.
We’ll see what happens with this one, but if Nvidia drivers are not a blocker and startup times are important to you, do consider using Clear Linux as a base AMI for your EC2 machines.
EBS volumes are sluggish at start-up
The next issue we looked at is Python startup times. To run a function on the EC2 machine, meadowrun starts a Python process which reads the function to run and its pickled arguments from disk, and runs it. However, just starting that Python process without actually running anything, on first startup took about 7–8 seconds.
This seems extreme even for Python (yes, we still cracked the inevitable “we should rewrite it in Rust” jokes).
A run with -X importtime revealed the worst offenders, but unfortunately it’s mostly boto3 which we need to talk to the AWS API, for example to pull Docker images.
Also, subsequent process startups on the same machine take a more reasonable 1–2 seconds. So what’s going on? Our first idea was file system caching, which was a close but ultimately wrong guess.
It turned out that AWS’ EBS (Elastic Block Store) which provides the actual storage for EC2 machines we were measuring, has a warmup time. AWS recommends reading the entire device to warm up the EBS volume by using dd. That works in that after the warmup, Python’s startup time drops to 1–2 seconds. Unfortunately reading even a 16GB volume takes over 100 seconds. Reading just the files in the meadowrun environment instead still takes about 20 seconds. So this solution won’t work for us—the warmup time takes longer than the cold start.
There is a possibility to pay for “hot” EBS snapshots which give warmed-up performance from the get-go, but it’s crazy expensive because you’re billed per hour, per availability zone, per snapshot as long as fast snapshot restore is enabled. This comes to $540/month for a single snapshot for a single availability zone, and a single region like us-east-1 has 6 availability zones!
At the end of the day, looks like we’ll just have to suck this one up. If you’re an enterprise that’s richer than god, consider enabling hot EBS snapshots. For some use cases reading the entire disk up front is a more appropriate and certainly much cheaper alternative.
If your code is async, use async libraries
From the start, meadowrun was using fabric to execute SSH commands on EC2 machines. Fabric isn’t natively async though, while meadowrun is—meadowrun manages almost exclusively I/O bound operations, such as calling AWS APIs and SSH’ing into remote machines, so async makes sense for us.
The friction with Fabric caused some headaches, like having to start a thread to make Fabric appear async with respect to the rest of the code. This was not only ugly, but also slow: when executing a parallel distributed computation using Meadowrun’s run_map, meadowrun was spending a significant amount of time waiting for Fabric.
We have now fully switched to a natively async SSH client, asyncssh. Performance for run_map has improved considerably: with fabric, for a map with 20 concurrent tasks, median execution time over 10 runs was about 110 seconds. With asyncssh, this dropped to 15 seconds—a 7x speedup.
Conclusion
Not everything you find while optimizing is actionable, and that’s ok—at the very least you’ll have learnt something!
Takeaways which you may be able to apply in your own adventures with AWS:
- If startup time is important, try using Clear Linux.
- EBS volumes need some warmup to reach full I/O speed—you can avoid this if you have lots of money to spend.
To stay updated on Meadowrun, star us on Github or follow us on Twitter!


Top comments (4)
Thanks for writing this. Eliot looks like it might be a good tool for
investigating some performance bottlenecks that I have been handling by debugger/profiling that doesn't quite provide the data I need.
Thanks John. I've had good experience with Eliot, the only thing I would say is it does affect import times a bit, as it also pulls in pyrsistent and a few other dependencies. So I've been reluctant to actually merge the Eliot code changes into main so far. We could address that by abstracting it behind an optional module, but haven't put in the work so far.
Thanks for the info Kurt. I also have a few other issues:
import eliotfails.Also #3 is required to allow the user to disable logging. This is required for performance if Roundup is deployed to a raspberry-pi for example. Setting the log level to Error with native python logging allows the user to remove the performance issues without code base changes.
I may be able to wrap eliot calls in if blocks but ....
Re: 3 I had the same idea, I don't want Eliot as a runtime dependency of meadowrun (or at the very least only as an optional one).
I started by making a facade to Eliot in an optional_eliot.py module, and mocking the calls if the import fails: github.com/kurtschelfthout/meadowr...
Please be advised that that file is only a very rough sketch - the actual Eliot calls work but the mock calls definitely don't. I think that approach would be nicer than trying to wrap every eliot call in an if, with similar small overheads if Eliot is not present.