Reconstructing an OpenAPI Specification through Observation
APIs are ubiquitous in modern microservice architectures. They make it easy to consume data from external apps and reduce the amount of code developers need to write. The general result is easier delivery of useful software products. However, the prevalence of APIs means they represent a large attack surface. In fact, Gartner predicts that by 2022, API attacks will be the most common attack vector for enterprise web applications. Similarly, an IBM report found that two-thirds of data breaches could be traced to misconfigured APIs.
Clearly, enterprises need to take a proactive approach to ensure their use of APIs is secure. Unfortunately, with the complexity of modern apps, third-party code dependencies, and a lack of documentation, API observability is a huge challenge. Often, enterprises simply don’t have any API specifications for their production apps. As a result, security-related misconfigurations go undetected, and apps use a variety of deprecated “zombie APIs” and undocumented “shadow APIs” in production.
The fundamental first step to solving this problem is to create an API spec and use it to audit and document the APIs your apps use. Ideally, we would create an API spec simply by observing API traffic in real-world applications. In the past, there was no simple, scalable, and open-source tooling capable of doing this. Now, we have APIClarity—an open-source API traffic visibility tool for Kubernetes (K8s) clusters. It’s purpose-built to address the gap and enable API reconstruction through observation.
In this post, we’re going to look at what API reconstruction is and how APIClarity solves the API observability problem. Then, we’ll walk through a practical example of using APIClarity with a microservices-based app running on K8s.
The Importance of API Reconstruction
Put simply, API reconstruction is the building of an API specification simply by observing traffic to and from that API. Done right, API reconstruction gives you visibility into the APIs your microservices use and enables you to assess your API security risks. Once the spec is built, the same tooling can compare runtime traffic against the specification to detect deviations.
Key components of an API specification include:
- Parameter detection (paths, header parameters, query parameters, request body parameters, and cookies)
- Object references
- File transfer
- Security definitions
Ideally, an API reconstruction tool needs to quantify these components in an OpenAPI Specification (OAS) compliant format without introducing unnecessary overhead or complexity to an app. Before APIClarity, there were several tools that partially addressed API reconstruction use cases, but there were no comprehensive open-source solutions. Some of these other tools for API visibility include:
- Optic—an extensible, language-agnostic, and open-source tool. It’s useful for documenting, reviewing, and approving API prior to deployment.
- SwaggerHub—a popular tool for converting API traffic to OAS.
- CloudVector API Shark—can monitor multi-service environments and generate an OAS specification from runtime traffic.
- Imvision—a robust API visibility and documentation tool for multi-service environments.
Optic wasn’t built for monitoring multi-service environments, and SwaggerHub doesn’t integrate with runtime environments. Neither API Shark nor Imvision are open source. None of the above tools fully met the needs for API reconstruction.
How APIClarity Solves the API Reconstruction and Visibility Challenge
APIClarity fills the gaps left by other tools and provides a robust, open-source, and scalable multi-service API visibility and reconstruction solution. It easily integrates into existing environments using a service mesh framework. With APIClarity, developers can import an API spec or reconstruct one based on observation. Developers can also monitor all API traffic in real-time with no code or workload changes required.
So, how does it work?
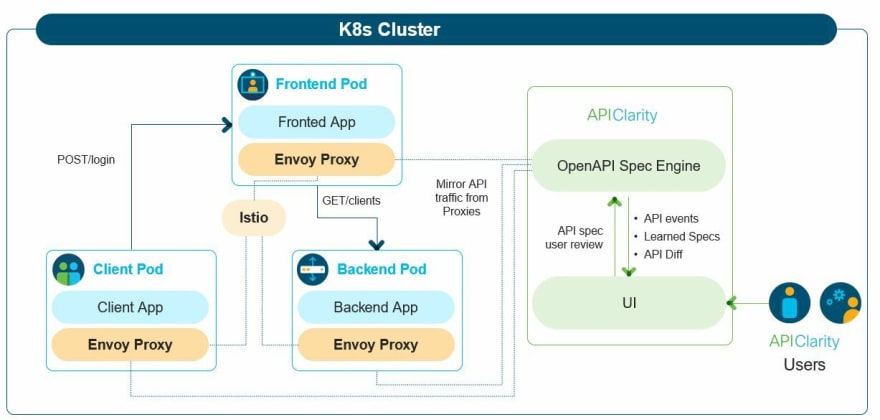
- APIClarity is deployed in existing K8s clusters
- API traffic is mirrored from pods in the cluster to APIClarity’s OpenAPI Spec Engine
- The spec engine monitors internal and external traffic and records API events
- APIClarity learns specifications based on API traffic and builds an API spec
- Users review, edit, and approve specifications
- APIClarity alerts users to security issues or if there is any deviation between an observed API and the approved API spec
APIClarity in Action: A Walkthrough
Now that we know what APIClarity is, let’s dive into our tutorial to see it in action with a K8s cluster and microservices-based application. Here, we will:
1) Deploy the Sock Shop app in our K8s cluster. While we’ll use Sock Shop as our example application, you can deploy your own app to your cluster and still follow along.
2) Deploy APIClarity in our K8s cluster and configure monitoring
3) Observe API traffic on the APIClarity dashboard
4) Review and create an API specification and view the generated OpenAPI spec in Swagger format.
5) Identify deviations from an API spec along with usage of shadow and zombie APIs.
6) View and filter API events
Prerequisites
To follow along, you’ll need:
- Kubernetes cluster with a default
StorageClassdefined - Istio 1.10 or above, installed on the cluster
Your K8s cluster can be deployed on any platform you prefer, including minikube. While APIClarity supports multiple integrations for proxying API traffic, you need to download and install Istio.
Deploy the Sock Shop app in your K8s cluster
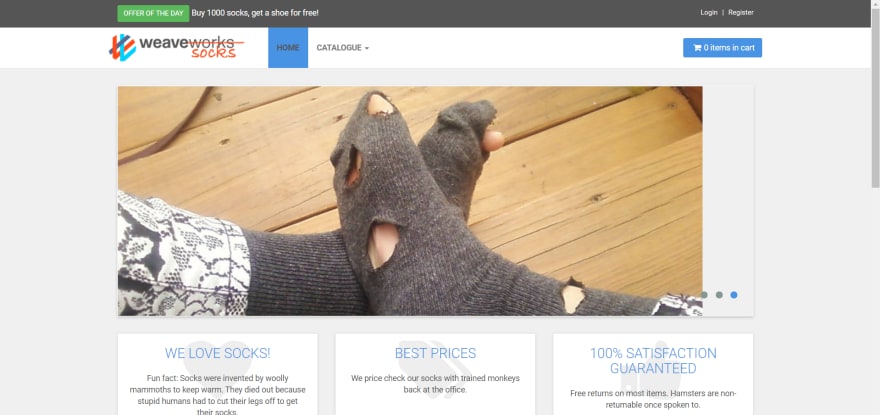
We’ll use the popular Sock Shop microservices application as our test app. With 14 different microservices and an interactive front-end, it is a great way to test API traffic in a K8s cluster.
1) Create the sock-shop namespace.
kubectl create namespace sock-shop
2) Enable Istio injection for the sock-shop namespace.
kubectl label namespaces sock-shop istio-injection=enabled
3) Deploy the Sock Shop demo app in your cluster.
kubectl apply -f https://raw.githubusercontent.com/microservices-demo/microservices-demo/master/deploy/kubernetes/complete-demo.yaml
4) Get the NodePort for the front-end service.
kubectl describe svc front-end -n sock-shop | grep NodePort:
The output should look something like this:
NodePort: <unset> 30001/TCP
5) Connect to http://<node_IP>:<NodePort> in your browser. Using our example above, if our node’s IP is 192.168.49.2, browse to http://192.168.49.2:30001. If you don’t know your node’s IP, you can verify with kubectl get nodes -o yaml or minikube ip. If everything is working, the Sock Shop demo app should load.
Deploy APIClarity in our K8s cluster and configure monitoring
First, we need to deploy APIClarity in our cluster.
1) We’ll start by cloning the GitHub repository to our home directory:
cd ~
git clone https://github.com/apiclarity/apiclarity
2) Next, navigate to the apiclarity directory.
cd apiclarity
3) Use kubectl to deploy APIClarity. Using the default apiclarity.yaml, the namespace will be apiclarity.
kubectl apply -f deployment/apiclarity.yaml
4) Confirm the pods are running.
kubectl get pods -n apiclarity
The output should look something like this:
NAME                          READY   STATUS    RESTARTS   AGE
apiclarity-679949b687-x25pb   1/1     Running   0          16m
apiclarity-postgresql-0       1/1     Running   0          16m
5) Initialize and update the wasm-filters submodule:
git submodule init wasm-filters
git submodule update wasm-filters
6) Navigate to the wasm-filters folder:
cd wasm-filters
7) Run the wasm ./deploy.sh script so the Envoy Wasm filter can capture traffic from our Sock Shop. The script accepts multiple namespaces as input parameters, e.g. ./deploy.sh <namespace_one> <namespace_two> <namespace_three>, but for this demo, we only need to specify the sock-shop namespace.
./deploy.sh sock-shop
8) Configure port forwarding for the APIClarity.
kubectl port-forward -n apiclarity svc/apiclarity 9999:8080
9) Use a web browser to connect to the APIClarity GUI at http://localhost:9999.

Observe API traffic on the APIClarity dashboard
Now, it’s time to generate traffic. Start by clicking through the different buttons and menus in the Sock Shop app.
💡Pro-tip: The more API traffic, the better! More traffic = more observations = deeper visibility. For this portion of our demo, we just need a little bit of traffic, but keep this principle in mind for production.
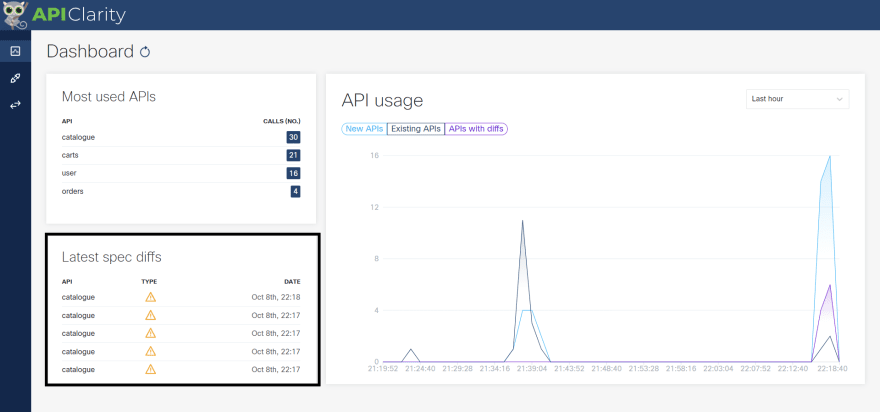
After you’ve generated some API traffic in Sock Shop, head back to the APIClarity dashboard. You’ll notice that APIClarity has recorded all the different API calls that have been made. In our example below, we can see 17 calls to the catalogue endpoint, eight calls to carts, and three calls to user. We can also see how APIClarity begins to graph API usage. Those graphs will get even more interesting—and useful—after we generate more traffic and create our API specifications.

Review and create an API specification and view docs in Swagger
Now, let’s create an API specification based on the relatively small amount of traffic we have.
1) Click on one of the “Most used APIs.” I’ll use catalogue.

2) Click the” Reconstructed” tab and then click “Review.”


3) Here, we can review API paths, add parameters, and merge entries. I’ll add an example_param and review and approve the paths. Feel free to experiment with your choices here.


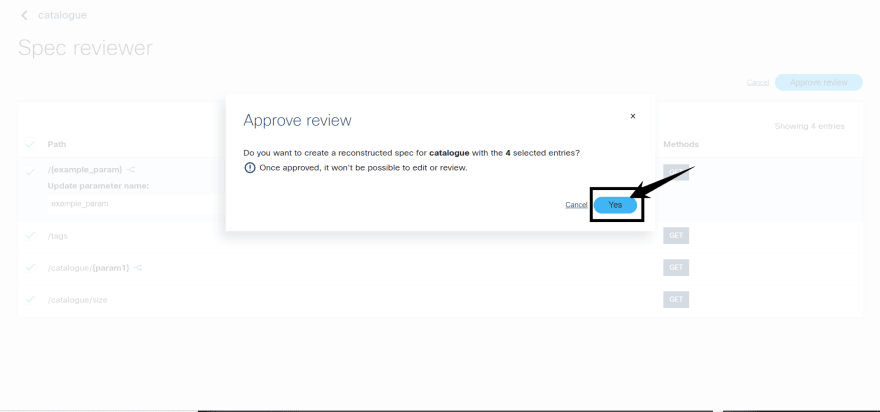
4) Now, we have an OAS API specification. We can view the API docs in Swagger directly from the APIClarity GUI.


Identify deviations from an API spec
Now that we have an API specification as a baseline, APIClarity can flag deviations from the spec to help detect security issues and shadow APIs. To see how that works, go back to the Sock Shop GUI and experiment some more. Click on some features or filters you did not use last time. If you created an order, delete it. The key here is performing some actions that are not in the spec. Those will be identified as “diffs.”
For example, here I made multiple calls to the catalogue endpoint that don’t match my spec:
We can drill down by clicking a specific diff and view exactly what is different from the spec. Here we can see the deviation was detected because my API call was missing some parameters.
That’s an example of a documented API call with different parameters than the specification. But, what if the API call isn’t documented in the specification at all? In that case, APIClarity will flag it as a shadow API.
That’s exactly what happened for this API call to the carts path. At the time we created the spec, we only observed a GET and a POST, so that is what was documented. Therefore, a DELETE call was outside of the spec and flagged as a shadow API.

As you might expect, this is a legitimate API call that I should have documented. This scenario provides us with a practical example of why it’s useful to let APIClarity capture a large amount of traffic before creating your API specification.
View and filter API events
We can also view and filter API events with APIClarity.
To view events, click on the events icon:
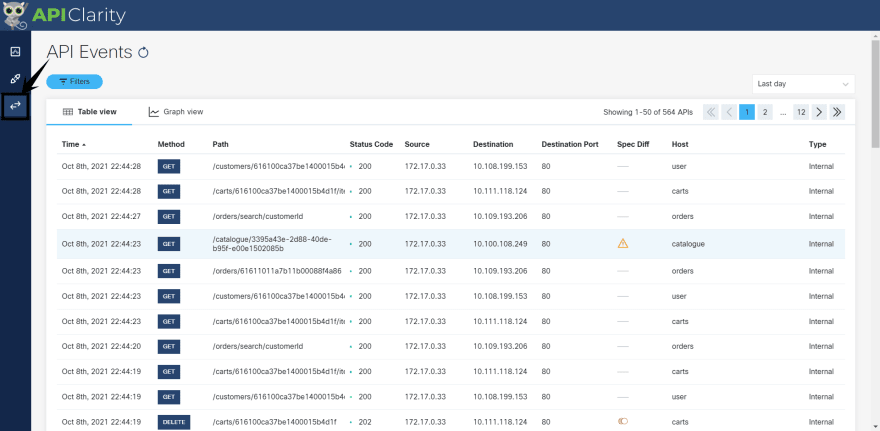
Here you will see a detailed list of all the API events over a given period of time (“Last day” is the default). We can also drill down to review individual events as we did from the dashboard:
Additionally, you can apply advanced filters to search for specific API events. For example, we can create a list of all the shadow API calls APIClarity has observed by applying the Spec of type is shadowfilter.
Detection of zombie APIs is similar. We would modify the filter to look for Spec of type is zombie. If one of our calls was to a deprecated API from our spec, we'd then see it here.
You can mix and match filters and sort results to achieve a variety of different views. That way, you can take deep dives on API events in your app.
Final thoughts
As an open-source project, APIClarity continues to evolve and receive contributions from the developer community.
I hope you enjoyed this walkthrough! We’ve only scratched the surface here, and there are several interesting use cases for API reconstruction and traffic monitoring with APIClarity. In addition to improving API visibility and security, it enables use cases like fuzzing tests, client/server code generation, and improving internal and user-facing documentation.

Top comments (0)