How do you construct a boxpot with ease using R
How to plot Boxplot in R-programming
box plot also is very similar to all others graphs in method. All we need to draw it is our data then the box plot() function.
let's see how it works.
Example
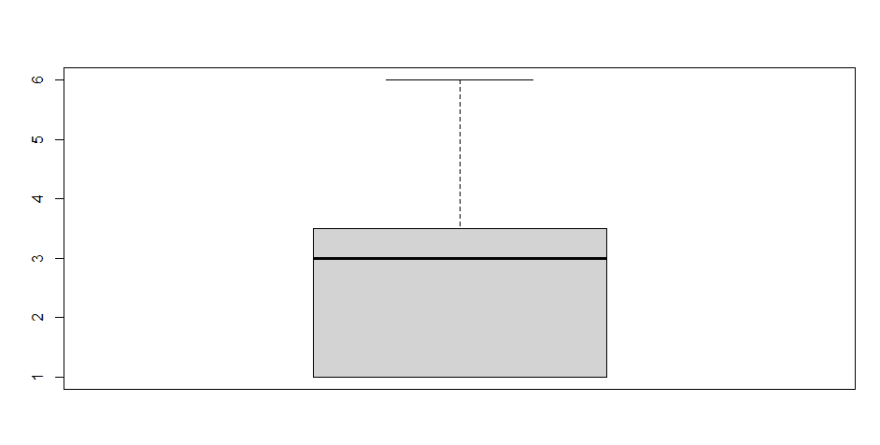
Represent the following weight of some students in boxpot.
1,3, 6, 1,3,3, 4, 3, 3, 1, 3 ,5 ,1, 2, 1 ,4, 3, 2 ,3 ,1 ,
1, 1 ,1, 4, 3, 1,5,5
Codes
weight=c(1,3, 6, 1,3,3, 4, 3, 3, 1, 3 ,5 ,1, 2, 1 ,4, 3, 2 ,3 ,1 ,1, 1 ,1, 4, 3, 1,5,5)
boxplot(weight)
Result>>

Now that is nice, how about given it color and title?? then we can make use of some other parameters in boxplot() function. they are :
main: to write the main title of the graph
col: to give preferable colour for our boxpot.
col.main : to give a preferable font color of our main title
xlab: to give a label on x axis
ylab: to give a label on y axis
border: to give a preferable color for the border instead of black.
let's practice it and see how it works
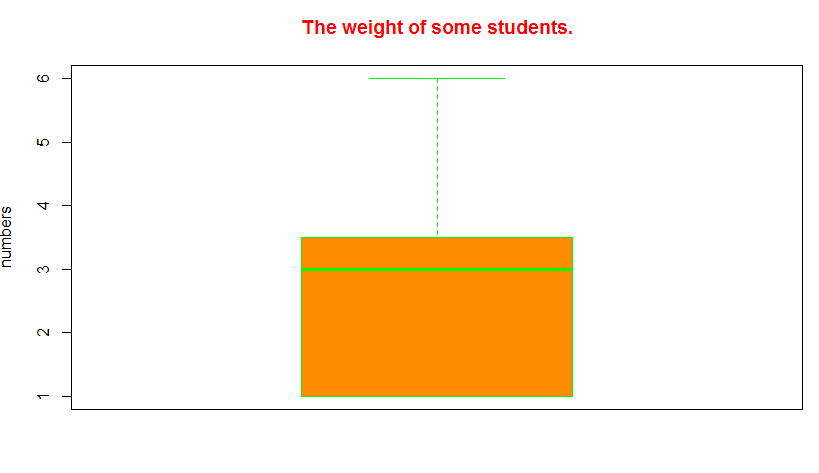
Example2
use the weights in example to plot boxplot.
codes>>
weight=c(1,3, 6, 1,3,3, 4, 3, 3, 1, 3 ,5 ,1, 2,
         1 ,4, 3, 2 ,3 ,1 ,1, 1 ,1, 4, 3, 1,5,5)
boxplot(weight,
        ylab = "numbers",
        main = "The weight of some students.",
        col = "darkorange",
        col.main='red',border='green')
Result>>
One more thing is that you can have more than one boxplot on your graph, just list them in the boxplot() function.
Example
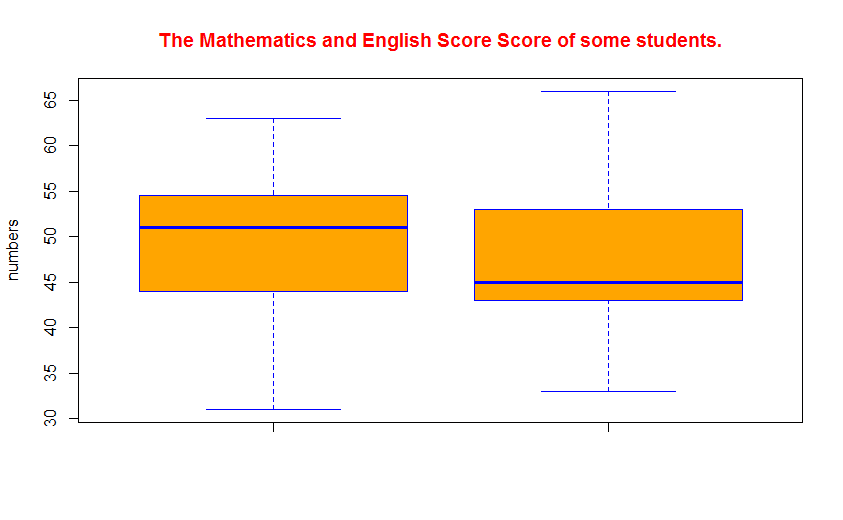
the following show the score of some student in mathematics and english. use the two data below to plot boxpot.
Mathematics={61,53, 46, 61,63,53, 44, 43, 43, 61, 33 ,45 ,31, 52, 51 ,54, 53, 44 ,38 ,51 ,41, 51 ,61, 44, 53, 61,45,55}
English = {51,43, 66, 51,43,33, 44, 53, 63, 41, 53, 45 ,51, 52,
61 ,44, 33, 42 ,53 ,61 ,61, 51 ,41, 44, 43, 41,45,45}
Solution.
Codes>>
Mathematics=c(61,53, 46, 61,63,53, 44, 43, 43, 61, 33 ,45 ,31, 52,    51 ,54, 53, 44 ,38 ,51 ,41, 51 ,61, 44, 53, 61,45,55)
English = c(51,43, 66, 51,43,33, 44, 53, 63, 41, 53, 45 ,51, 52,
         61 ,44, 33, 42 ,53 ,61 ,61, 51 ,41, 44, 43, 41,45,45)
boxplot(Mathematics,English
        ylab = "numbers",
        main = "The Mathematics and English Score of some students.",
        col = "orange",
        col.main='red',border='blue')
Result>>
Now I believe you now understand both stem and boxplot. I hope you find this article helpful?? consider to follow me. it's the guy Maxwizard. chat me up on whatsapp(07045225718) if you have any question on this or any big deal. enjoy coding!

Top comments (0)