Intro
This time, I will try "WaveShaperNode" to use distortion.
Environments
- Node.js ver.16.8.0
- TypeScript ver.4.3.5
- Webpack ver.5.42.0
- ts-loader ver.9.2.3
- webpack-cli ver.4.7.2
- chart.js ver.3.5.1
Use WaveShaperNode
The distortion is made by clipping the wave.

To intentionally cause clipping, I can use "WaveShaperNode".
index.html
<!DOCTYPE html>
<html lang="en">
    <head>
        <title>Audio sample</title>
        <meta charset="utf-8">
    </head>
    <body>
        <div>
            <canvas id="curve_view" style="width: 30vw; height: 30vh;"></canvas>
        </div>
        <script src="./js/main.page.js"></script>
        <script>Page.init();</script>
    </body>
</html>
main.page.ts
let audioContext: AudioContext;

export async function init(): Promise<void> {
    const medias = await navigator.mediaDevices.getUserMedia({
        video: false,
        audio: true,
    });
    audioContext = new AudioContext();
    const audioSourceNode = audioContext.createMediaStreamSource(medias);

    const distortion = audioContext.createWaveShaper();
    distortion.curve = makeDistortionCurve(50);
    distortion.oversample = '4x';

    audioSourceNode
        .connect(distortion)
        .connect(audioContext.destination);
}
function makeDistortionCurve(amount: number): Float32Array {
    const sample = 44100;
    const curve = new Float32Array(sample);
    const deg = Math.PI / 180;

    const viewCanvas = document.getElementById('curve_view') as HTMLCanvasElement;
    for (let i = 0; i < sample; ++i ) {
        const x = i * 2 / sample - 1;
        curve[i] = ( 3 + amount ) * x * 20 * deg / ( Math.PI + amount * Math.abs(x));
    }
    return curve;
}
Curve
WaveShaperNode has two properties.
They are "curve" and "oversample".
"oversample" is for anti-aliasing for drawing the curve.
So I can think the most important property for distortion is "curve".
Like the code sample above, the curve is expressed by Float32Array.
Because I want to display the curve visually, I use Chart.js.
Draw the curve
I add Chart.js and some code like last time.
main.page.ts
import { Chart, ChartConfiguration, ChartTypeRegistry } from "chart.js";

let audioContext: AudioContext;

export async function init(): Promise<void> {
    const medias = await navigator.mediaDevices.getUserMedia({
        video: false,
        audio: true,
    });

    audioContext = new AudioContext();
    const audioSourceNode = audioContext.createMediaStreamSource(medias);

    const distortion = audioContext.createWaveShaper();

    distortion.curve = makeDistortionCurve(50);
    distortion.oversample = '4x';

    audioSourceNode
        .connect(distortion)
        .connect(audioContext.destination);
}
function makeDistortionCurve(amount: number): Float32Array {
    const sample = 44100;
    const curve = new Float32Array(sample);
    const deg = Math.PI / 180;

    for (let i = 0; i < sample; ++i ) {
        const x = i * 2 / sample - 1;
        curve[i] = ( 3 + amount ) * x * 20 * deg / ( Math.PI + amount * Math.abs(x));
    }
    drawSample(curve);
    return curve;
}
function drawSample(values: Float32Array) {
    const viewCanvas = document.getElementById('curve_view') as HTMLCanvasElement;

    const labels: string[] = [];
    for(const v of values) {
        labels.push(v.toString());
    }
      const data = {
        labels: labels,
        datasets: [{
          label: 'curve',
          backgroundColor: 'rgb(255, 99, 132)',
          borderColor: 'rgb(255, 99, 132)',
          data: [...values],
        }]
      };
      const config: ChartConfiguration<keyof ChartTypeRegistry> = {
        type: 'line',
        data: data,
        options: {}
      };
    new Chart(canvas, config);
}
But I got an error.
ncaught (in promise) Error: "line" is not a registered controller.
After all, I added "registerables".
main.page.ts
import { Chart, ChartConfiguration, ChartTypeRegistry, registerables } from "chart.js";

let audioContext: AudioContext;

export async function init(): Promise<void> {
    Chart.register(...registerables);
...
}
- Chart.js core.js:6162 ERROR Error: "line" is not a registered controller - Stack Overflow
- Chart.js - GitHub
Curve shape
The result of drawing the curve like below.
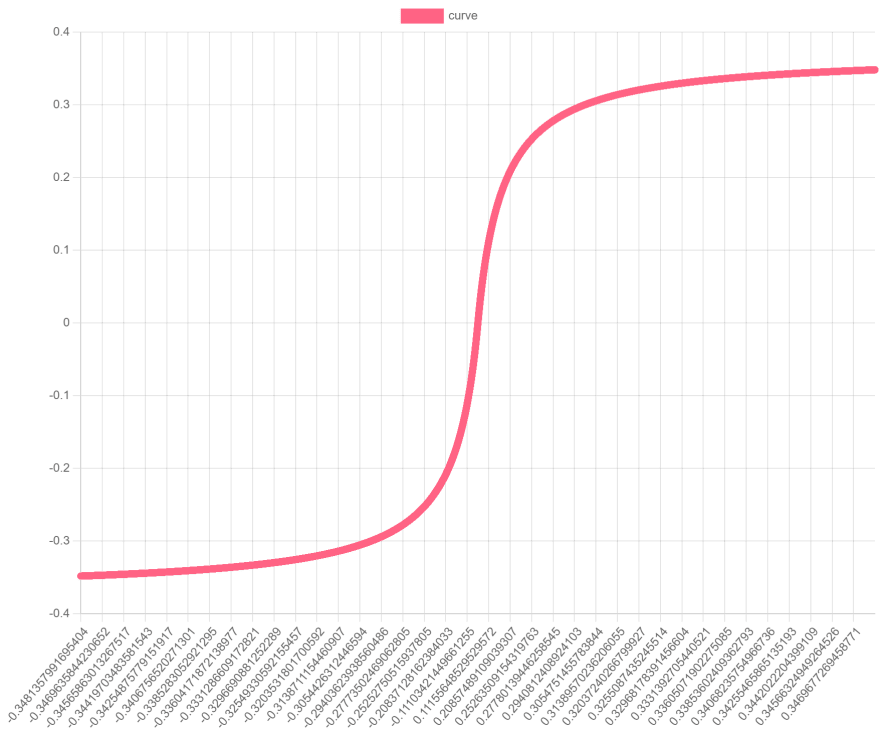
I change the curve values.
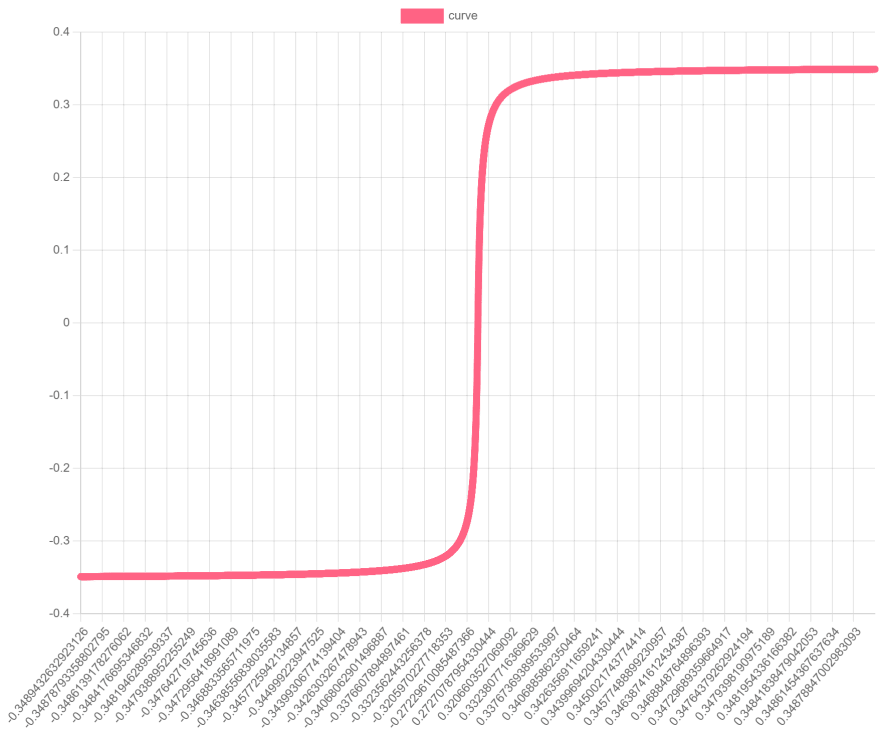
amount
If I change the "amount" value of the argument of "makeDistortionCurve" more larger, the curve will be close to a right angle and the distortion will be harder.
amount = 400
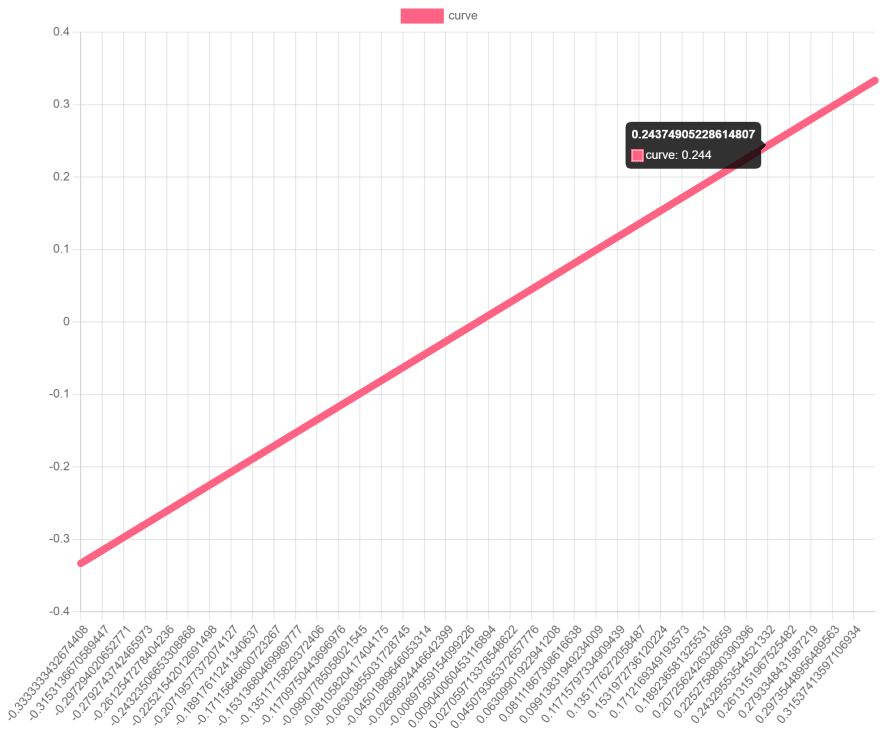
If I set "0", I can hardly feel the distortion.
amount = 0
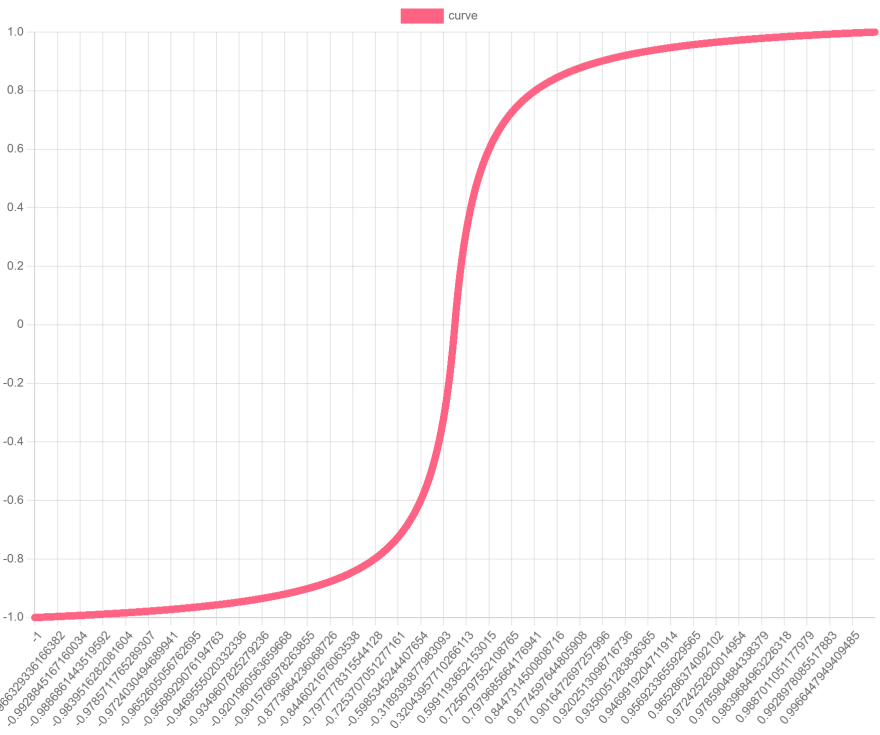
Range
Their range is from -1 to 1.
If I change the range more wider, the sound will be more larger.
main.page.ts
...
function makeDistortionCurve(amount: number): Float32Array {
    const sample = 44100;
    const curve = new Float32Array(sample);
    const deg = Math.PI / 180;

    const viewCanvas = document.getElementById('curve_view') as HTMLCanvasElement;
    for (let i = 0; i < sample; ++i ) {
        const x = i * 2 / sample - 1;
        curve[i] = (Math.PI + amount) * x / (Math.PI + amount * Math.abs(x));
    }
    drawSample(viewCanvas, curve);
    return curve;
}
...

Top comments (0)