Intro
This time, I will try saving the line charts as images.
Offset
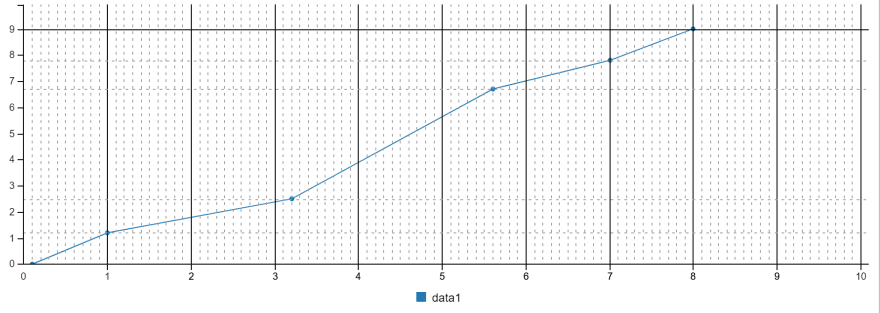
The chart what I created last time, the positions of 0 weren't at start point.

To set offset values as 0, add "padding" into "axis".
chartViewer.ts
import c3 from "c3";
import { ChartValues } from "./chart.type";

export class ChartViewer {
    private chartElement: HTMLElement;
    private chart: c3.ChartAPI|null = null;
...
    public draw(value: ChartValues): void {
        const valueXList = this.getValueX(0, 10);
        const ticksX = this.getTicks(valueXList);
        const valueYList = value.values.map(v => v.y);
        const gridLineY = valueYList.map(t => this.generateGridLine(t));
        const gridLines = valueXList.map(t => this.generateGridLine(t));

        this.chart = c3.generate({
            bindto: this.chartElement,
            data: {
                x: "x",
                columns: [
                    ["data1", ...value.values.map(v => v.y)],
                    ["x", ...value.values.map(v => v.x)],
                ],
                types: {
                    data1: "line"
                },
            },
            axis: {
                x: {
                    min: 0,
                    max: 10,
                    tick: {
                        values: [...ticksX],
                        outer: false,
                    },
                    padding: { left: 0, }
                },
                y: {
                    min: 0,
                    padding: { bottom: 0, }
                }
            },
            grid: {
                x: {
                    show: false,
                    lines: [...gridLines],
                },
                y: {
                    show: false,
                    lines: [...gridLineY],
                }
            },
            interaction: {
                enabled: false,
            },
        });
    }
...
}
Result
Save as an image
I can save the chart as an image.
chartViewer.ts
...
    public saveImage(): void {
        const svg = this.getSvgRoot();
        if(svg == null) {
            console.error("svg was null");
            return;
        }
        const serializedImage = new XMLSerializer().serializeToString(svg);
        const image = new Image();
        image.onload = () => {
            const canvas = document.createElement("canvas");
            canvas.width = this.chartElement.clientWidth;
            canvas.height = this.chartElement.clientHeight;
            const ctx = canvas.getContext("2d");
            if(ctx == null) {
                console.error("ctx was null");
                return;
            }
            ctx.drawImage(image, 0, 0);
            document.body.appendChild(canvas);
        };
        image.src = "data:image/svg+xml;charset=utf-8;base64," + window.btoa(serializedImage);
    }
...
main.page.view.ts
import { ChartValues } from "./charts/chart.type";
import { ChartViewer } from "./charts/chartViewer";

export class MainPageView {
    private chartRoot: HTMLElement;
    private charts: ChartViewer[] = [];
    public constructor() {
        this.chartRoot = document.getElementById("chart_root") as HTMLElement;
    }
    public updateValues(values: readonly ChartValues[]): void {
        const sampleChart = new ChartViewer(this.chartRoot);
        sampleChart.draw(values[0]!);
        this.charts.push(sampleChart);
        // To save images, I must wait for drawing the chart.
        setTimeout(() => {
            sampleChart.saveImage();
        }, 100);
    }
}
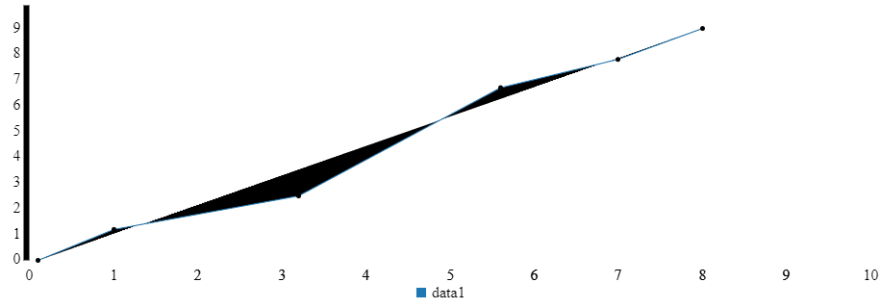
Result
Set CSS values
One problem is that the saved image doesn't reflect the CSS.
So the line what had been drawn in the image was filled and the grid lines weren't drawn.
To draw them, I have to set styles by TypeScript(JavaScript).
chartViewer.ts
...
    public saveImage(): void {
        const svg = this.getSvgRoot();
        if(svg == null) {
            console.error("svg was null");
            return;
        }
        const chartPaths = this.getElementsBySelector(svg, ".c3-chart path");
        const axisPaths = this.getElementsBySelector(svg, ".c3-axis path");
        const lines = this.getElementsBySelector(svg, ".c3 line");

        const gridLines = Array.from(axisPaths).concat(Array.from(lines));
        chartPaths.forEach((element) => {
            this.setCssValue(element);
        });
        gridLines.forEach((element) => {
            this.setCssValue(element, "green");
        });

        const serializedImage = new XMLSerializer().serializeToString(svg);
        const image = new Image();
        image.onload = () => {
...
        };
        image.src = "data:image/svg+xml;charset=utf-8;base64," + window.btoa(serializedImage);
    }
...
    private getElementsBySelector(element: SVGElement, selector: string): readonly CSSStyleDeclaration[] {
        const results: CSSStyleDeclaration[] = [];
        const nodes = element.querySelectorAll(selector);
        for(let i = 0; i < nodes.length; i++) {
            const node = nodes[i];
            // Force getting "style" attribute.
            if(node != null &&
                    (node as any)["style"] != null) {
                results.push((node as any)["style"]);
            }
        }
        return results;
    }
    private setCssValue(style: CSSStyleDeclaration, stroke?: string): void {
        style.fill = "none";
        if(stroke != null) {
            style.stroke = stroke;
        }
    }
}
Result
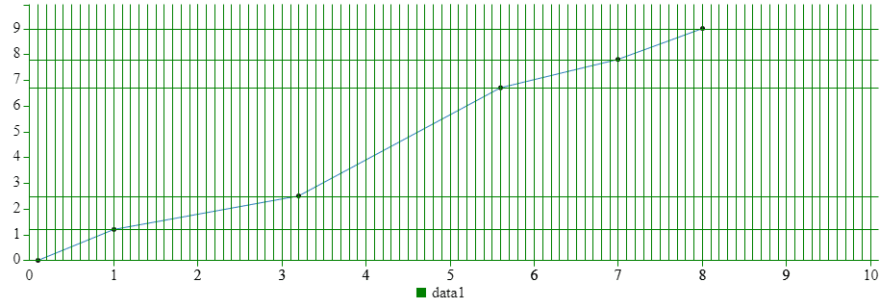
Because I haven't set CSS values yet, next time I will try do that.

Top comments (0)