
If you are a programmer, I am sure you have found yourself many many times “debugging” a system by writing strings to the console / stdout / file. Those messages were usually something like “passed here!”, “false branch”, “now about to enter loop” and maybe even some “fuc..” or “WTF” too.
If you were “lucky” and your system went into production it’s very likely that you had to support and maintain it. How many times you found yourself “debugging” an error in production by reading hundreds of log files?
That’s not debugging. That’s text reading.
Imagine if you could live debug for real (with a real debugger) a deployed application? And that the application could even be running remotely. Or suppose that the application had an error and instead of writing a text-based stack trace, you could dump a snapshot of the execution stack (with all its variables and state) and then do a post-mortem analysis in your development environment (yes, again, with a real debugger)?
Is this how debugging will work in the future? No. I’ve been doing it already for years. Smalltalk has had this ability since at least 1995.
Don’t text the console. Inquire the process.
What is wrong with text reading and poor man’s debugging?
I could write a whole blog post about this, but here are some thoughts:
- It’s a very unproductive and unpleasant task. It’s even worse if you have to do the stop – change (add logging) – start cycle.
- It’s error prone. For example, you could have broken code while adding or removing your printing statements.
- Whenever you finish your “debugging”, you must spend time rolling back all the changes. Even worse, you may forget some debugging code which makes it into production.
- When you are looking at a log you are blind. You have no information about the execution stack (what was the state of this variable at this point? no clue..). At most, you could get “some” info thanks to the printing of the temp variables of each frame.
- It’s not enough for mission critical systems. Many times, when there is an error and a system is down, it may be losing millions of dollars per hour.
Do you think that reading a log really helps? Maybe. But I hope I have already convinced you that we can do a lot better.
Demo: a simple web application
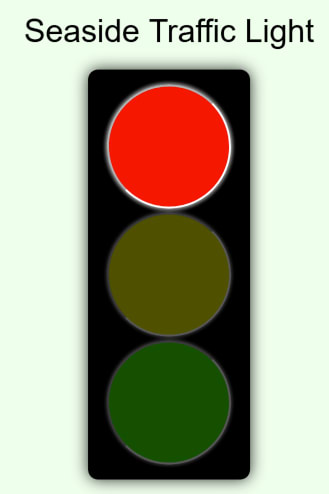
For this post I will be using a demo web application (written with Seaside framework) that represents a simple Traffic Light. When you click one of the three lights, the clicked one turns on and the others turn off:
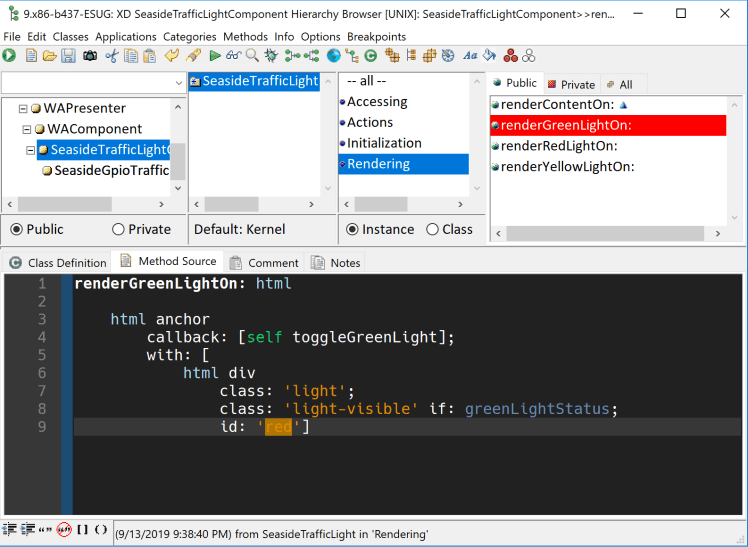
One important detail is that, for demoing purposes, we put an error on one method that gets called when the green button is clicked:
toggleGreenLight
    | boolean allLights |
    boolean := true.
    allLights := Array new.
    allLights first turnOff.
    allLights second turnOff.
    self setGreenLight: boolean.
Did you spot it? No? Then keep reading ;) In this example we see one error in particular but everything I will show works exactly the same as if that would have been any kind a runtime error.
Now, we would need another machine that acts as the “production” server in which we could deploy our application and see how we can debug it. OK, for that, I will be using a Raspberry Pi that could be running anywhere in the world. This would also help me demonstrate how cool these unique debugging techniques are for IoT.
The debugging features I will be showing here are part of VASmalltalk but some of these features exist on other Smalltalk dialects.
Scenario 1: running on development
This is simple. He have the application running locally in our development environment and if we click the green button, we get a debugger:

In this situation there is not much magic. Well, at least for Smalltalkers. For non Smalltalkers there is some magic. For example you can inspect objects, send messages to them, evaluate code, change code and then just resume the execution. Yes, no stop-compile-start cycle. Live coding as they say. Do you now understand why we (Smalltalkers) love developing in the debugger?
Scenario 2: running on production with text logs
We are now running our application in our production machine (in this example a Raspberry Pi) and we will be using the classical log file for error handling.
Below you can see an extract of the generated log file (here it is called walkback.log). This is likely what you are most familiar with:

Taking a detailed look at the above log file illustrates the limitations I mentioned earlier in this post.
Scenario 3: running on production with binary stack dumping
Finally!!! The cool stuff begins :) In this case, when I clicked the green button the application did not generate a log file but a binary seaside.sdf. That file contains a snapshot of the execution stack at the moment the exception happened.
The magic is that later on I can then take any development environment, open a debugger, attach that seaside.sdf file and do a post-mortem analysis!

In this example, I copy the file from the server into my development machine and here is the result:
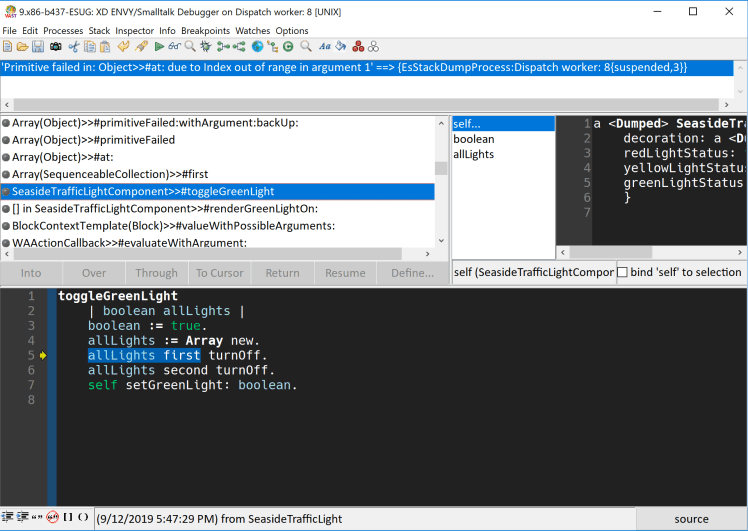
You can notice that on this debugger the Into, Over and all the navigation buttons are disabled. This is because this is a snapshot of a stack so you can’t really change it (wait for next section!). However, you can see how much friendlier this is than dealing with log files. Here you can see that I can inspect objects, I can see their state, etc…
At this point, the error should be clear: the variable allLights is empty and so sending first to it throws an exception. The fix here was to simply use an existing method turnAllOff:
toggleGreenLight

    self turnAllOff.
    self setGreenLight: true
Just to summarize: I have a local debugger opened with a snapshot of the execution stack when an exception was triggered on a remote server.
Scenario 4: running on production with live remote debugging
The previous binary stack dump is great for doing post-mortem analysis of production errors, but what if we want to live debug what is happening on the server? Or in a IoT board? Well, we can then use the remote debugger feature.
For this demo what I want to do is to halt the execution (like a breakpoint) at a certain place so that I could open a debugger and see what is going on. For that I added a Halt halt at the beginning of the method:
toggleGreenLight
    Halt halt.
    self turnAllOff.
    self setGreenLight: true
The remote debugger works via TCP which means:
- The “target” (remote system) must know the IP (or hostname) of the “development” environment.
- We need certain port to be opened in the network.
- We can remotely debug ANY remote system running anywhere in the globe. In this case, the Raspberry Pi is next to me, but it would the same if it is 14k km away.
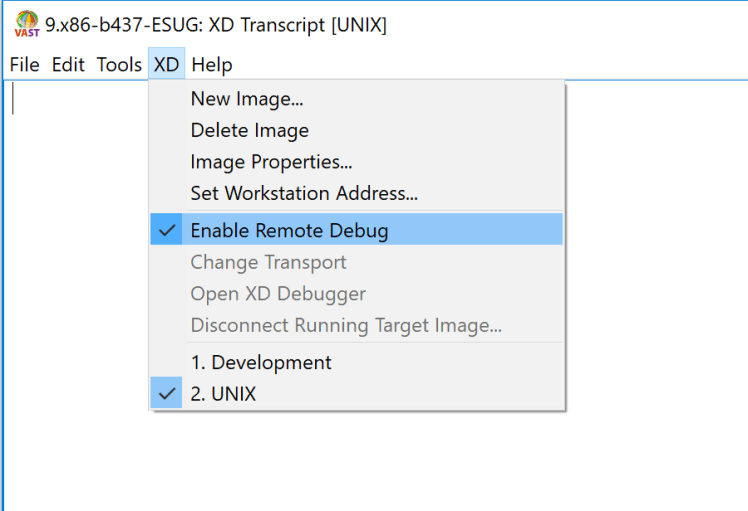
The first thing I need to do is to tell my “development” environment to listen for possible remote connections:
Now, I can simply run the web application and click on the green button. The browser would then look like “waiting” on the callback of the button.

But…if I now go to my development machine…I see a debugger that came in!!!

Into, Over and the rest of the buttons are now available. Again, I can inspect objects, see their state and send messages to them. But in addition, I can change code and resume the execution (just as I did when developing on my local machine!). For example, let’s change the code so that now the green light is red:
And then I just click on Resume button. The debugger disappears and the web browser continues its rendering (but now, obviously, the green light is red):

Just to summarize: I have a local debugger opened with a live execution stack when an exception was triggered on a remote server. I even could modify code and resume the exception to continue its normal execution.
Too magical to believe it? Am I cheating?
The text and the screenshots might not be enough to properly show all these features, therefore, I recorded this short video to show things working live:
Other possible uses?
I have only shown a few scenarios, but there are more! Some others I am aware of:
- Debugging Continues Integration test failures: sometimes a test failed on the CI but not on your local machine. So… we just added stack dumping to tests that fail. That way, you simply download the stack file and see what happened.
- Sharing “errors” between the community: instead of sharing a plain string stack, you share stack dump.
- Debugging AWS Lamba services.
- Debugging on IoT.
Conclusions
We have been doing this for years. The binary stack dump and remote debugging of VASmalltalk dates from around 1995. Yes, 24 years ago. Pharo and GemStone Smalltalks both have similar features. In fact, I co-authored that Pharo development in 2012 which won first place at the ESUG Innovation Technology Awards.
So this is what “debug to the future ” looks like. The pun is doubly intended: Smalltalk has allowed this kind of debugging since ages ago, although it may look like a futuristic approach to programmers who haven’t tried it. Also, with the ideas shown in the post, you can see how you can have a stack trace now, but debug it much later, even in a different environment, kinda like suspended animation for computing processes.
Being a software professional also means caring about the tools you choose to use. I can use vim and know lots of great hotkeys, but I also have a nice monitor and a mouse, so why can’t I just enjoy and take some advantage of modernity?
I’d love for you to use Smalltalk (that would be very cool), but at the very least fight for having decent debugging capabilities in whatever language you are using.
People now use the trendy words “Technical debt”. Well, I promise that replacing a text editor and grep with a debugger does help to reduce it.
Finally, don’t stay with the idea that this is just something “cool”. It is cool, but it also brings a lot of value to businesses and customers.
It’s time to move forward.
PS: Thanks to all the BA-ST Slack group and Instantiations team that help me a lot with ideas, quotes, revisions and much more!

Top comments (0)