In this post, I will cover some basic data wrangling techniques that we can do with Python and Pandas. Actually, here I will also introduce the excellent Python package dfply.
What is data wrangling and why is it an important technique to know in Python?
Processing of data is known as data wrangling, data munging, data, grunging, or data preparation processes. The purpose of the processing of the data is to format the information so that it can be analyzed later. This step is extremely important because the majority of the working hours usually are spent in order to process the data. Often, the majority of the analysis code (e.g., in Python) will be concerned with data munging, which processes the data. It is, therefore, extremely important to learn this in an efficient and robust way. To select the rows and columns of the data without a doubt two of the most basic of tasks. Furthermore, to add new variables (e.g., columns to Pandas dataframe), or modifying variables are also examples of two essential tasks.
Thus, it is important to learn from, for example, R and Python tutorials, and, Pandas tutorials, like this one.
Today, there are all the necessary functions to process the data. Unfortunately, however, these features are often difficult to use or results in code that is difficult to read. Developers, and data scientists, in the R community, took note of this early on and came up with several libraries, to carry out data wrangling. One of my favorite libraries is undoubtedly dplyr, part of the tidyverse library, and dplyr has maybe been the most revolutionary of the libraries, as it has introduced in a completely new way to manipulate data. In the dplyr, simplicity is in focus; with a small number of functions, some of which are simple and easy to use, enables powerful processing of data. The Python community has observed that dplyr became very popular, and because of this, there are equivalent Pyton packages. In fact, there are three packages for Python: dfply, pandas-ply, and plython. In this post, I will exemplify how powerful, and easy, one of these packages are; dfply. This, I would say, makes Pandas (and dfply) one of the essential Python packages for data science.
Installing Python Packages
In case you need to install Pandas and dfply, here's how to get them installed using pip:
pip install pandas dfply
Importing Data in Python with Pandas
Now, before we go on and have a look at how to munge data with Python we need some example data. Here, you will import a dataset (from a .csv file) from a URL:
import pandas as pd

df = pd.read_csv('https://vincentarelbundock.github.io/Rdatasets/csv/Ecdat/Earnings.csv',
                index_col=0)
Checking the first five rows of the dataset can be done using the head() method:

Data wrangling in Python with Pandas and dfply
In this section, you are going to learn how to rename columns in Pandas dataframe with dfply. After this, you are going to learn how to calculate simple descriptive statistics.
Changing Column Names in Pandas Dataframe with dlfply
Here's how easy it is to change the column names in the dataframe. First, we import dlfply:
from dlfply import *
This is was done through the use of the function from, followed by a *, which will activate all of the functions available in the Python library, and we don't have to write "dfply." in front of each and every function that we want to use.
Second, we use piping, and the rename() method:
df = df >> rename(Wage='y',
            Age='age')

Note, how we used >> in order to create a chain of events. The real power with this, may not be evident in the simple example code above. However, using this method enables us to carry out a lot of data wrangling tasks in a single line of code.
Summary statistics in Python with dlfply (and Pandas)
Here's how easy it is to calculate descriptive statistics (by groups) with dlfply:
df >> group_by('Age') >> summarize(mean=X.Wage.mean(),
                                   meadian=X.Wage.median(),
                                  std=X.Wage.std())
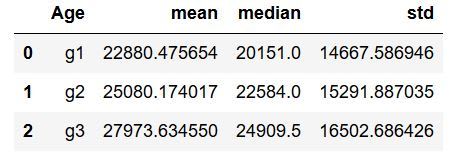
Again, the code begins with a "df >> group_by('Age'), which is interpreted as ”the start with df, then group df by Age group”. This means that the following functions will be carried out on Age groups (from the column). Then, we proceed to summarize(mean=X.Wage.mean(), which implies that we describe that; including mean, the median, and the standard deviation of Wage. Please note that we do use X to tell Python that Wage is derived from the same dataframe we started off with (df).
Hope you learned something, please share if you did!

Top comments (0)