
To understand the difference in the data between JavaScript-based analytics and server logs, I’ve compared the stats between Plausible Analytics as client-side analytics and AWStats as server-side analytics on my own website in June 2020. Here are the results.
Top line stats
Here are my top line stats for June in Plausible Analytics. You can see my complete data for the month of June in this open dashboard.

And here are my top line stats from AWStats:
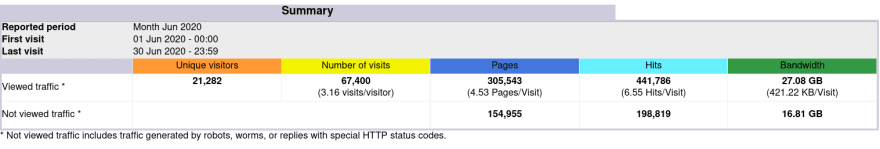
There is a great data disparity between the two.
The total number of unique visitors
- Plausible Analytics: 10.3k
- AWStats: 21.2k
More than 100% higher number of visitors according to AWStats.
The total number of page views
- Plausible Analytics: 16.8k
- AWStats: 305.5k
18 times higher number of page views according to AWStats.
Top referrers

- Plausible Analytics: Google 6.4k
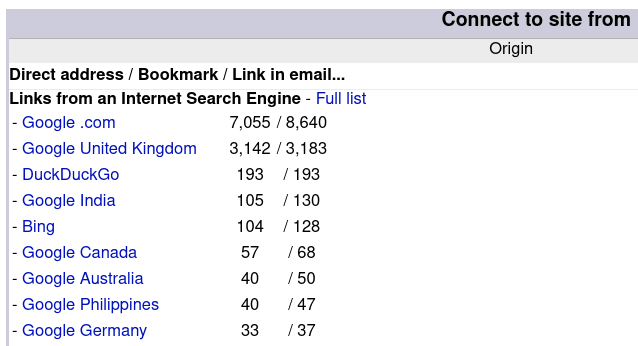
- AWStats: Google USA 7k, Google UK 3.1k
Plausible Analytics displays all traffic from Google under one referral. AWStats splits traffic from Google according to the locality. Between Google USA, Google UK, Google India and others, there were more than 10,000 visitors from Google combined according to AWStats.
Top pages

- Plausible Analytics: /blog-or-vlog/ 2.5k
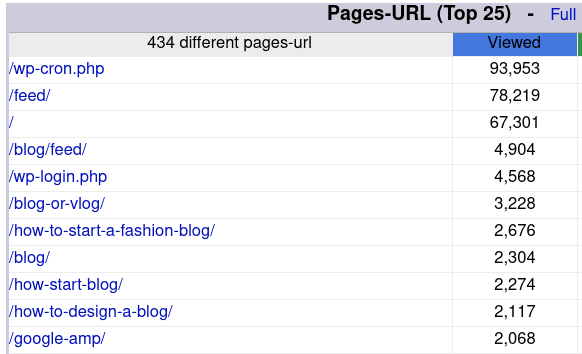
- AWStats: /wp-cron.php 93k, /feed/ 78k, home page 67k
Most of the page views and pages that AWStats counts are made by bots to the backend pages that are not customer facing. My actual top post, /blog-or-vlog/, is 6th in the list on AWStats with 3.2k views.
Top countries

- Plausible Analytics: USA 3.2k
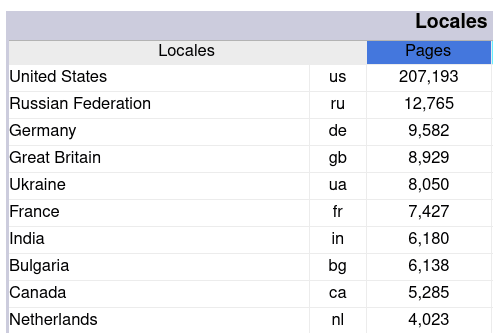
- AWStats: USA 207k (doesn’t show the number of unique visitors but a number of page views)
Interestingly enough, Russia is listed second on AWStats while it doesn’t even make it into the top 10 on Plausible Analytics.
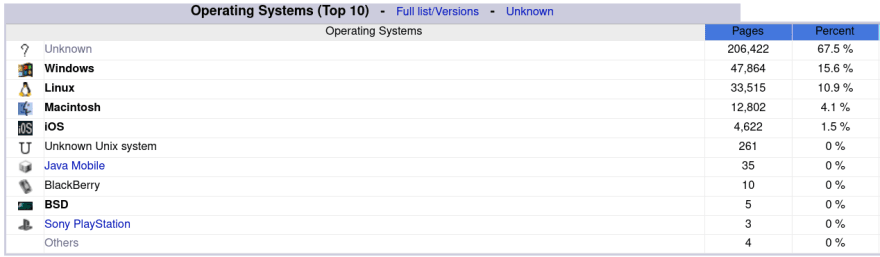
Top operating systems
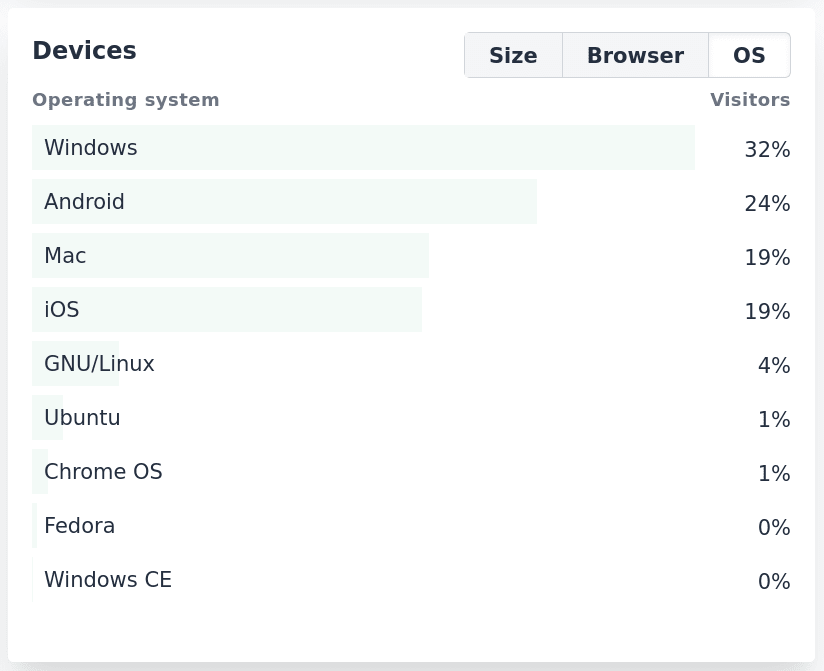
- Plausible Analytics: Windows 32%
- AWStats: “Unknown” 67.5% (doesn’t show the number of unique visitors but a number of page views). Windows is second with 15.6% of all page views.
Top browsers
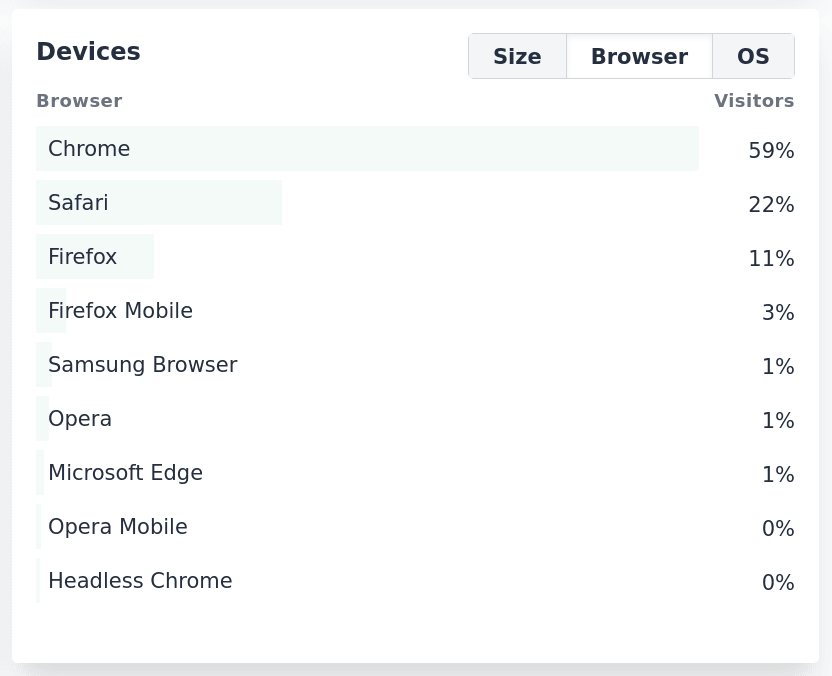

- Plausible Analytics: Chrome 59%
- AWStats: “Unknown” 64.7% (doesn’t show the number of unique visitors but a number of page views). Chrome is second with 18.5% of all page views.
Conclusion
It seems very clear that the majority of data included in AWStats is made by robots. AWStats tries to isolate and exclude robots. They automatically exclude the “not viewed traffic” which includes “traffic generated by robots, worms, or replies with special HTTP status codes”.
Despite these efforts, it seems to miss out on a lot of bot traffic.
There could be a way to make it more accurate by manually excluding other bots. If I exclude back-end pages such as wp-cron.php, /feed/ and wp-login.php that the bots are trying to access, I may get something closer to the actual numbers.
Similar is the case with top operating systems and top browsers. If I exclude the “unknown” category in AWStats, the remaining table becomes a bit more usable. Same for top countries with Russia, for instance, having way too inflated numbers on AWStats compared to the reality.


Top comments (1)
Aren't server-side analytics always going to lose out to pages served from caches further down the line?