
Reporting in Salesforce Marketing Cloud can be challenging for new users. The "reports" available through Analytics Builder are limiting and difficult to work with. But with a little knowledge of SQL and Data Views, creating data tables tailored to your business use case becomes possible.
Below is an example of a report created to track the basic "health" of a business unit: subscriber growth and the number of emails sent, opened, clicked and bounced. It's completely based upon Marketing Cloud's Data Views, so the exact same SQL queries should work for any account.
Some queries could be combined or separated depending on the number of records in the business unit - this was developed for a client with more than 1.2 million records and never take more than a few minutes.
Step 1
Run a SSJS activity to create the 3 data extensions needed for the report using this code:
Using this SSJS will make sure the fields are the exact same name and data type needed for the SQL queries below to work without modifications. For more information on how you can create data extensions using SSJS and WSProxy, read Ivan Razine's exceptional guide here.
Step 2
Create a SQL activity that appends the Account_Health_Daily data extension with the following code:
Why append? Because many Data Views only track the last 180 days of activity. By appending new records, we can keep some basic information about the account longer. This could be useful if we wanted to make year-over-year comparisons etc.
Step 3
Unfortunately, appending Account_Health_Daily means the most recent day's stats will be added to the end of the data extension. Since SQL can't overwrite the same data extension used as a source, a second data extension will be made to sort the records by most recent day first.
Use the following code to overwrite the data extension Account_Health_Daily_Sorted:
Step 4
Now that the basic stats from each day are logged, they can be grouped together by month. Start with the following code to overwrite the Account_Health_Monthly data extension:
Step 5
Next, record the number of active subscribers on the 1st of the month using the following SQL code to update Account_Health_Monthly:
Step 6
Finally, calculate the open, click and bounce rate for the month by updating Account_Health_Monthly with this SQL query:
Step 7
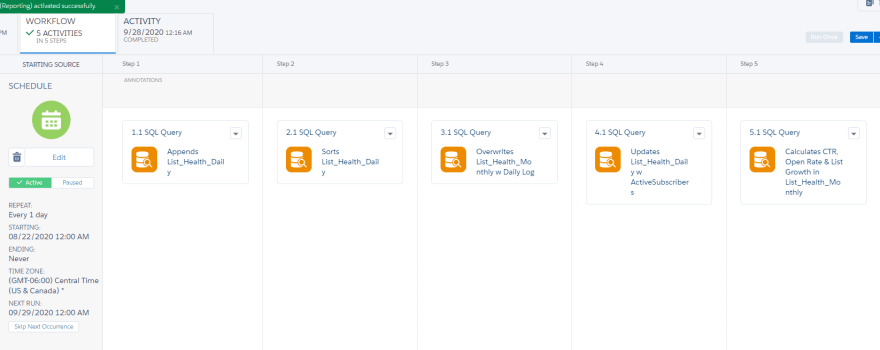
Now an Automation can be created to append and update the data extensions. Schedule an Automation to run every day, with the SQL activities in the following order:
- Appends Account_Health_Daily with Data View info
- Overwrites Account_Health_Daily_Sorted
- Overwrites Account_Health_Monthly with Account_Health_Daily info
- Updates Account_Health_Monthly with Active Subscribers
- Updates Account_Health_Monthly with Open, Click, Bounce Rates
Adding Previous Days
The SQL query appending the daily log are carefully written to only include data from the previous day - and only that one day. To append Account_Health_Daily with previous days, use the following code:
The above query will look into the data extension, find the oldest day on record and append the next oldest. Keep running it manually or place it in an automation to run until Account_Health_Daily has enough information to be useful.
Presenting Reporting Data
Data extensions are the basis of all custom reporting in Marketing Cloud - but they can be difficult for humans to sift through for useful information.
Below are two examples of HTML blocks to build inside Content Builder and placed into an email or cloud page. They group together the business unit's basic stats for the previous week - and three more weeks for context. It's a good start to presenting the information from the data extensions in a way that is actually helpful.
Additional Notes
- Subscribers can open and click emails days, even months after it was sent. Don't be surprised if there are single days where a business unit has stats that appear impossible.
- Reporting in Marketing Cloud is rarely 100% accurate. Look for trends, not exactness in your data.
- The code needed for this report can be found in a github repository here.
Summary
With the above code, you can have the necessary data extensions setup, an automation to refresh them and an HTML block to neatly present the data in less than an hour. It can help answer some common questions like:
- When did our open or click rates start to increase or decrease?
- When did our account grow or shrink?
- When did our bounce rate suddenly increase?
This "Account Health" report is just one example of the awesome things you can develop with a little SQL in Marketing Cloud. What are some examples of "reporting" data extensions you've built in Marketing Cloud and why?
(This report was developed while working as a Marketing Cloud consultant for LearningCurv in Austin, TX)


Top comments (1)
FYI instead of SELECT TOP 9223372036854775807 you can do a SELECT TOP 100 PERCENT :D
Thanks for the post, helped a lot!