
TLDR
Learn how to read the confusion matrix to understand model performance.
Outline
- Introduction
- Before we begin
- Yes or no
- Confusion matrix
- The matrix generated
- Results
Introduction
In this series, we’ll be judging our machine learning model we trained for our email remarketing campaign. To get started, we need to recognize what type of model it is and the performance metrics used to determine whether a model is bad, average, or good. We’ll begin by taking a look at how to generate and read a model's confusion matrix.
Before we begin
In this series, we’ll be reusing our training data and model from our Guide to Model Training. Begin by loading the model’s Pickle file, and split the dataset into train and test. For more information on this, check out the conclusion of the Guide to Model Training: Save & Load.
Yes or no
When we created our remarketing model, we determined that the problem was a binary classification problem, a yes or no question on whether an existing user would revisit the website after being sent an email. In a binary classification problem, the best way to tell where a model is good or bad is through a confusion matrix.
 Is this True or False? (Source: Facebook)
Confusion matrix
A confusion matrix takes into account the set of data created from the train-test-split when creating the model. The train-test-split creates model predictions (calculated result) with the known outcome (test set). These values are then compared to generate a confusion matrix. There are 4 quadrants in the confusion matrix: True Positive, False Positive, False Negative, and True Negative,. The first word represents whether the model predicted correctly, while the second is the actual outcome.
 Quadrants in order left to right (Source: GlassBoxMedicine)
Model outcome
It is worth noting that depending on what the outcome is, positive and negative doesn’t necessarily equate to good or bad. A model looking to calculate whether someone is infected or not, will have positives being more likely to be infected, which is bad. But in this case, since our model is on whether a user will come back, it will look at usage. Positive will be good since a user comes back, and negative will be bad, a user won’t return.
True Positives
The 1st quadrant of the confusion matrix contains the number of true positives. These are the number of times the model predicted positive results correctly, matching the outcome or goal. In the case of remarketing, this would be the likelihood of a user coming back to the product.
 Customer Satisfaction #1 (Source: NBRI)
False Positives
The 2nd quadrant of the confusion matrix contains the number of false positives. These are the number of times the model predicted that it would increase, but it didn’t. In other words, the model was wrong about positive outcomes. In the case of remarketing, this is when it expects a user to come back after being sent an email, but doesn't.
 Ghosted. (Source: LeftOnRead)
False Negatives
The 3rd quadrant of the confusion matrix contains the number of false negatives. These are the number of times the model has predicted that it would decrease, but it didn’t. In other words, the model was wrong about negative outcomes. In the case of remarketing, this is when the user would have come back if they got an email, but didn’t.
 There was an announcement? (Source: FoundersBeta)
True Negatives
The 4th quadrant of the confusion matrix contains the number of true negatives. These are the number of times the model correctly predicted that it would decrease the likelihood. In the case of remarketing, this is when the model believes that after sending an email to the user, they would still not use the product. This information is helpful to avoid annoying customers and being potentially flagged as spam.
 Flagged as Spam? (Source: conquest-tech)
The matrix generated
As with the rest of this series, we’ll be using the SciKitLearn Python library, and import the ConfusionMatrixDisplay function.
Using our data, we’ll be adding on Pyplot from matplotlib to generate an image of our confusion matrix. Here, I’ve chosen to color in my confusion matrix as blue and apply visual helpers using the color map, aka cmap.

Percentage
Another step that can be done is normalizing so that the values of everything have a percentage and may be easier to understand at a glance. This is done by setting the normalization flag to “true”.
Analysis
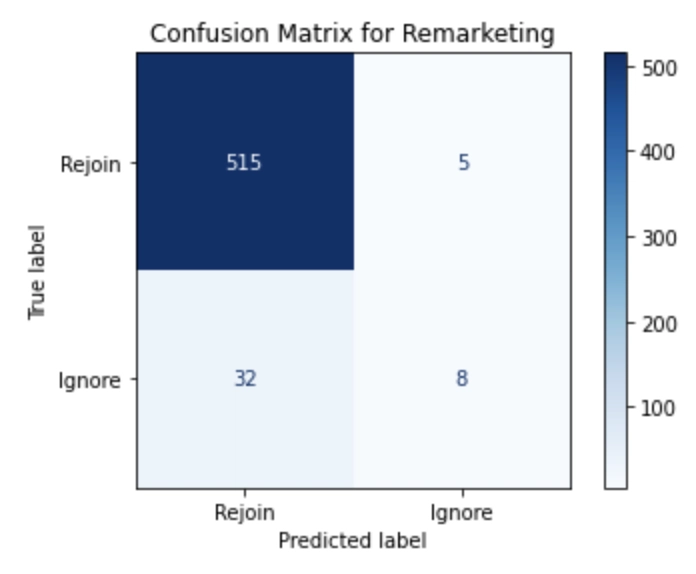
Based on our use case, there are 2 quadrants we care about looking at the most. Starting with the first quadrant of true positives, since our overall goal is to see how many users will come back. The next would be quadrant 4, False Negatives, since these are users that will come back and we missed them. Due to these factors, we want to see if our Confusion Matrix minimizes the number of False Negatives, and maximizes the number of true positives.
Results
We’ve analyzed the model and have determined that the confusion matrix isn’t ideal. There is a 20% chance of False Negatives, which we wanted to avoid the most. Thankfully, its redeeming factor is that the chance of True Positives are at 99% which should suffice for our email campaign. Our next step is to validate the trustworthiness of the model by using the confusion matrix’s values to come up with our metrics.

Top comments (1)
Confusion matrices can be confusing at first. But once you understand them, they provide a wealth of knowledge.