HadCRUT5 is a gridded dataset of global historical surface temperature anomalies relative to a 1961-1990 reference period. The dataset is a collaborative product of the Met Office Hadley Centre and the Climatic Research Unit at the University of East Anglia.
This project is made of a couple Python scripts: hadcrut5-plot.py and hadcrut5-bars.py. They parse the HadCRUT5 data files and produce a few different plots:
- line plot
- line plot using the N-year means data (smoother version)
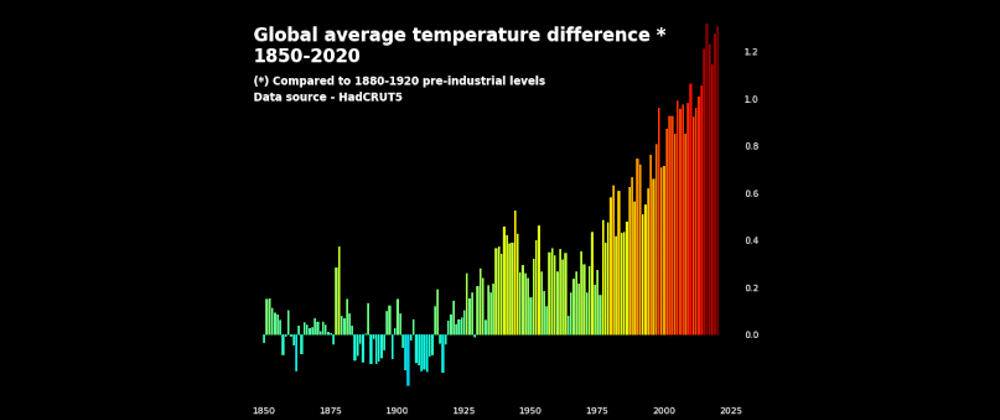
- bar plot
Each plot can be generated on different periods:
- 1961-1990 (the default one)
- 1850-1900
- 1880-1920
The scripts require the Python libraries: Matplotlib, netCDF4, NumPy, and Requests.
Project code available at: GitHub


Top comments (0)