
5 years ago, when I rented my first web server, one of the first things I wanted to do was to have a screen or TV in my room showing cool metrics about the server (CPU, RAM for example).
But because of my lack of experience with linux and servers, I never done that project and the idea got out of my mind.
During my first work experience, I used to collect metrics to manage many windows servers, but finally we used default metrics provided by Microsoft Azure, our cloud provider.
But the idea came back, and I discovered the ELK stack. I tried many times to setup this stack in my server, but the RAM consumption was a problem.
I discovered the Prometheus and Grafana Stack later. It was easier to setup with my server architecture, so I decided to use this stack. This post will describe how I setup this on my server, problems I encountered, etc.
Functional specifications
Here is the list of the principal specifications I wanted :
- Because of my server architecture, all the stack needs to works with Docker
- Be able to see CPU and RAM load in real time, and an alert system when those metrics is to high
- Be able to see CPU and RAM load per containers to better understand where problems come from
- Be able to show an interface to a passive screen in my room
If possible, here is the cool things I wanted to add :
- A down detector for my websites
- Detect problems after deployments
- Detect attacks
- Provide some dashboards to my friends who are hosting their website on my server
Technologies used
With these specifications, after some tests, I decided to use those technologies :
Netdata : metrics collector for the server and containers
To collect my servers metrics, I decided to use netdata for several reasons :
- By default, Netdata collects a lot of metrics in the host machine. It can also detect and provide metrics about all my Docker containers, without any configuration.
- It is very easy to install with Docker
- It is very light and not killing my server
- It also provide a really cool user interface with all the metrics it collect. That is very useful to understand the meaning of data collected.
I initially chose to use cAdvisor and
Node exporter, but I had a firewall problem with the communication between Node exporter and my Prometheus container. Also, cAdvisor use too many server resources.
Prometheus : time series database
I don't have any explanation why I decided to use Prometheus. It is the first I knew, it does not require too many resources and works with Docker.
I heard InfluxDB do the same thing, this could be a good alternative to Prometheus.
Grafana : the dashboard platform
I was really attached to use Grafana for this projet. The design is cools, and we can do every dashboard we want. Also, this is the perfect solution to connect many data sources, for extra features.
Uptime robot : down detector
I added this solution later for the down detector extra feature. I initially wanted to use worldPing, a Grafana plugin. But it adds too much things to Grafana, and it is not free for more than 3 websites. I searched for other solutions, and found Uptime Robot.
The free plan includes checks every 5 minutes, email alerts, 50 endpoints, and no installation is required. It suits my needs perfectly. Also, it can provide an API and already propose an exporter for Prometheus :
 lekpamartin
/
uptimerobot_exporter
lekpamartin
/
uptimerobot_exporter
Expose uptimerobot.com metrics for prometheus and visualize it in Grafana
How does it work ?
Here is my final monitoring architecture :
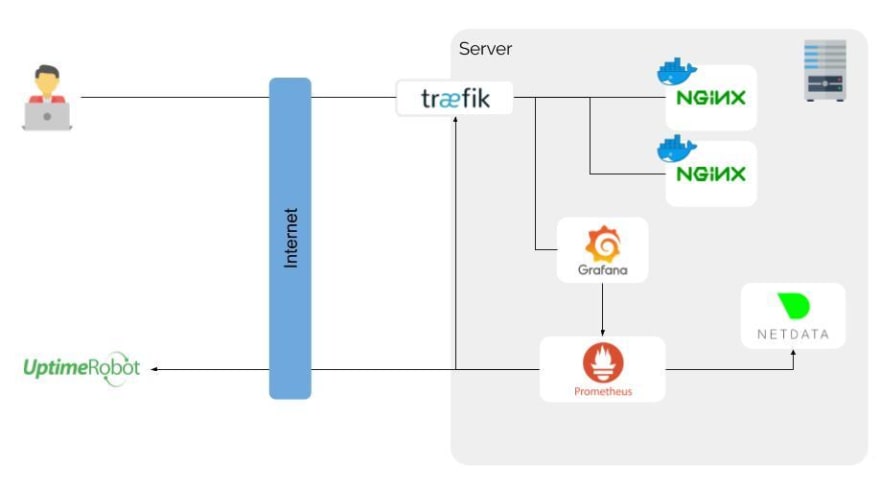
First of all, this architecture is proxyied behind Traefik, a cool reverse proxy that discover by itself all my containers. This is very useful in a docker based architecture. For the example above, it allows me to connect to many Nginx servers and, the most important here, Grafana.
Prometheus, the time series database, will ask every 5 seconds to Netdata all system metrics status. In the same time, it ask to Uptime Robot the status of my endpoints and to Traefik some informations about traffic.
This is the hardest thing. Now, we can use Grafana to make requests to Prometheus. Those requests are formatted with PromQL, a specific query language. I had some difficulties to understand this language and metrics significations sometimes, so I used a lot the Grafana Dashboards Library to import dashboards and analyse them to create my owns.
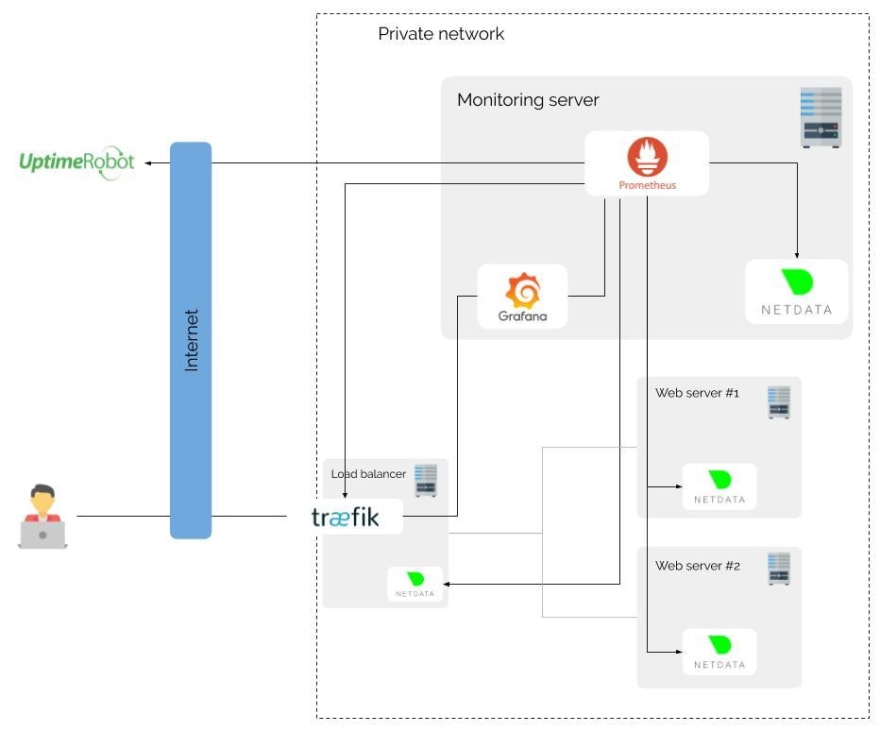
With that architecture, I can also expand my system. Indeed, I use this stack for one server, but it is totally possible to use it in an infrastructure scale :
Final results
Here is the result of all this work, in Grafana :
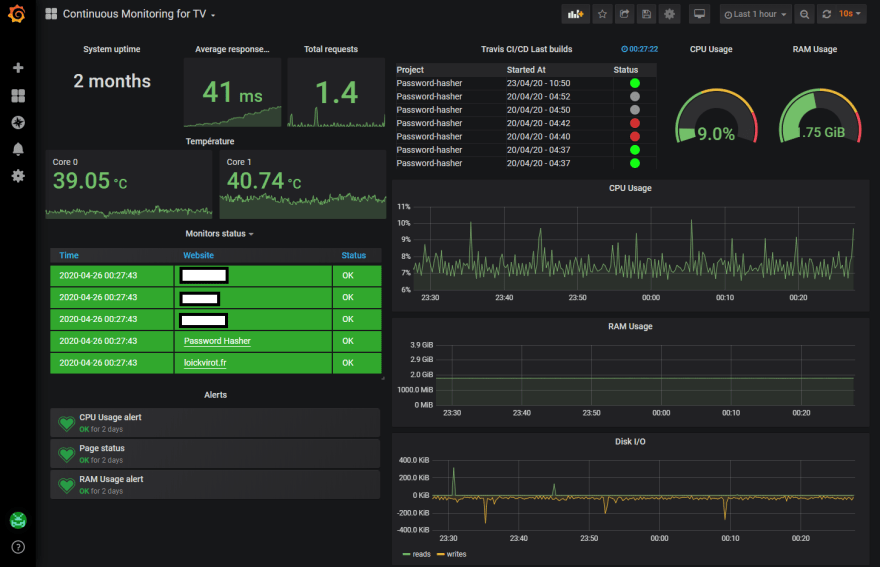
This dashboard is available 24/7 in a screen in my room. This is totally overkill for my purposes, but I love it !
It's easier to me to detect any problems, because I can visualize massive data quickly. Also, even if I don't look the dashboards, Grafana is capable to detect any problems and send me alerts via Discord, natively. With that, I can be alerted when my websites are down in approximately 15/20 min. That's not the ideal, but it's still better than nothing. It can be improve with the premium version of Uptime Robot, but the free plan is ok for my needs.
Thanks to Guilhem Mateo and Ambre Palanque for re-reading this post


Top comments (1)
That is awesome! btw, what software are you using to design that monitoring architecture?