
So it's been a while since GitHub introduced its profile readme feature which lets you customize your user profile. Since then, a lot of people have been creative with it, and have been developping on components like github-readme-stats, github-profile-trophy or waka-readme-stats.
Today, I'm introducing metrics, a set of various plugins that generates SVG images that you can embed in your user profile to make it even more prettier ! It can be setup either as a GitHub action or as a web server.
📊 20+ metrics about you !
The main plugin lets you display your account metrics, listed in three categories : Activity, Community and Repositories. Some common stats are included like number of commits, stars, contributions, ... But also a few more exotic ones like your prefered license !

You can configure it to hide some parts if you find it too cluttered. A lot of numbers can be intimidating for some people (unless it's on a paycheck haha).
Also, generated SVGs are transparents with a color font that blends well with both light and dark mode, so your visitors will be able to see it whichever side they are !
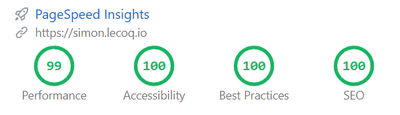
🚀 Faster than light with the PageSpeed plugin
If you have a website linked to your account, you can also display its PageSpeed performance scores and shows that you've mastered the web.
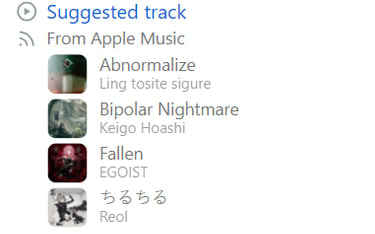
🎼 Show what you listen to with the music plugin
If you're using Apple Music or Spotify to listen music, you can use the Music plugin to display randomly music tracks from one of your favorite playlist. You'll just need to provide its embed url.
If you're brave enough to create a Spotify token, it's possible to display the track you recently listened to instead.

🎨 Reveal the artist in you with templates
The generated SVGs are rendered through EJS, which means you can actually use HTML, CSS and JS to template your metrics from the data gathered through the various GitHub APIs and plugins.
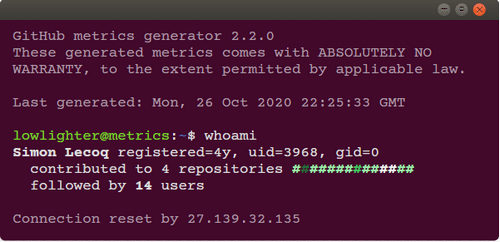
For instance, I made a more nerdy alternative template based on an unix terminal :
But if you're comfortable enough with web, you'll be fine making your own template. Don't hesitate to share it if you made something awesome !
🦑 Intrigued ?
There are even more at lowlighter/metrics, including documentation and source code. Try it now at metrics.lecoq.io !
Thanks for reading !


Top comments (0)