
Written by Faith Ng'etich✏️
In this article, we are going to learn what memory leaks are, what causes them, and their implications in a Node.js application.
Although Node.js works well with many applications thanks to its scalability, it has some limitations with regards to the heap size. To improve the efficiency of Node apps, it is important to understand why memory leaks occur and, even more so, how to debug them.
Understanding memory management reduces the likelihood of wasting your application’s resources, but the elusive nature of memory leaks and the unexpected effects they can have on performance make it critical to understand how Node.js manages memory.

How does Node.js manage memory?
Performance is critical to the adoption and usage of an application, which makes memory management an important facet of software development. For this reason, Node.js has some built-in memory management mechanisms related to object lifetimes.
For instance, Node.js dynamically allocates memory to objects when they are created and frees the space when these objects are not in use. Once the memory has been freed, it can be reused for other computations.
The allocation and deallocation of memory in Node.js is predominantly handled by the garbage collector (GC). Garbage collection refers to the process of finding all the live values and returning memory used by dead values to the system so they can be recycled later on.
The Node.js GC uses the heap data structure to store memory references to objects as they are created. This heap has a finite size, and the GC computes how fast the resources were depleted to dictate whether or not there could be a memory leak.
Every memory allocation brings you closer to a garbage collector pause. The GC identifies dead memory regions or unreachable objects through a chain of pointers from a live object, then reallocates or releases the memory to the OS.
On a lower level, Node.js uses the V8 JavaScript engine. In its own words, “V8 is Google’s open-source, high-performance JavaScript and WebAssembly engine, written in C++.” V8 executes code and manages the memory required for its runtime execution.
The management is done by allocating and freeing memory as required by the program. And while the Node.js GC does a considerably good job at managing memory, leaks still occur for various reasons.
Why do memory leaks occur?
“A memory leak is a type of resource leak that occurs when a computer program incorrectly manages memory allocations in such a way that memory which is no longer needed is not released”(Wikipedia).
Memory leaks occur when long-lived objects are attached to expectedly short-lived objects. A real-life example of how a memory can leak is shown in this code snippet:
const requests = new Map();
app.get( "/", (req,res) => {
    requests.set(req.id, req);
    res.status(200).send("Hello World");
});
The above example is likely to cause a memory leak because the variable requests, which holds a new instance of the Mapobject, is global. Thus, every time a request hits the server, there is a memory allocation to the object.
The guaranteed memory allocation to the new instance means that the object will live forever. The application will eventually run out of memory and crash when the number of requests consumes memory beyond the resources available to the application.
Memory leaks can be problematic if they go unnoticed, especially in a production environment. When incomprehensible CPU and memory usage increases in an application, chances are, there is a memory leak.
You probably can relate to this: memory usage grows to the point that an application becomes unresponsive. This happens when the memory is full and there is no space left for memory allocation, causing a server failure.
When this happens, most of us tend to restart the application, and voilà! All the performance issues are solved. However, this temporary solution does not get rid of the bug but rather overlooks it, which could trigger unexpected side effects, especially when the server is under heavy load.
Debugging memory leaks
In many cases, there is no clear understanding as to why a memory leak happened. In fact, such observations might be overlooked at their moment of occurrence, especially during development.
The assumption is that it will be fixed later once functionality has been achieved. These occurrences might not bug most people at that particular moment, and they tend to move on. Just keep in mind that memory leaks are not that obvious, and when the memory grows endlessly, it is good to debug the code to check for a correlation between memory usage and response time.
One such debugging strategy is to look at the necessary conditions in object lifetimes. Even though the performance of a program could be stable and/or seemingly optimal, there is a possibility that some aspects of it trigger memory leakage.
The version of code that runs correctly one day might leak memory in the future due to a change in load, a new integration, or a change in the environment in which the application is run.
Wasn’t garbage collection supposed to solve this?
In the context of memory management, garbage refers to all values that cannot be reached in memory, and as we mentioned earlier, garbage collection refers to the process of identifying live values and returning the memory used by dead values to the system.
This means that the garbage collector determines which objects should be deallocated by tracing which objects are reachable by a chain of references from certain “root” objects; the rest is considered garbage. The main aim of garbage collection is to reduce memory leaks in a program.
But garbage collection does not solve memory leakage entirely because garbage collection only collects what it knows not to be in use. Objects that are reachable from the roots are not considered garbage.
GC is the most convenient method for handling memory leaks, although one of the downsides is that it consumes additional resources in the process of deciding which space to free. This would thereby slow down processes, affecting the app’s performance.
Managing memory leaks
Memory leaks are not only elusive, but also hard to identify and debug, especially when working with APIs. In this section, we are going to learn how to catch memory leaks using the tools available.
We are also going to discuss suitable methods for debugging leaks in a production environment — methods that will not break the code. Memory leaks that you catch in development are easier to debug than those that make it to production.
If you suspect a memory leak in your application, chances are high that it could be a result of the uncapped increase in the app’s resident set size (RSS), which makes it rise without leveling off. As a result, the RSS becomes too high for the application to handle the workload, which could cause it to crash without an “out of memory” warning.
These are clear indicators that a program could have a memory leak. To manage and/or debug such occurrences, there are some tools that could be used to make the endeavor more fruitful.
Tools to help debug memory leaks
node-heapdump
The heapdump module is good for post-mortem debugging. It generates heap dumps on your SIGUSR2. To help catch bugs easily in a development environment, add heapdump as a dependency to your project:
npm install heapdump --save
Then add it in your root file:
var heapdump = require("heapdump");
You are now set to use heapdump to take some heap snapshots. You can call the function:
heapdump.writeSnapshot(function(err, filename){
console.log("Sample dump written to", filename);
});
Once you have the snapshots written down, you can compare them and get a hint of what is causing a memory leak in your application.
node-inspector
This is a debugger interface for Node applications that uses Blink Developer Tools, and it is used in Chromium. To get the hang of how the node-inspector works, you can read more about it here.
process.memoryUsage
This is a simple way of monitoring memory usage in your node applications.
The method returns:
-
rss– resident set size refers to the amount of space occupied in the main memory for the process, which includes code segment, heap, and stack. If your RSS is going up, there is a likelihood your application is leaking memory -
heapTotal– total amount of memory available for JavaScript objects -
heapUsed– total amount of memory occupied by JavaScript objects -
external– amount of memory consumed by off-heap data (buffers) used by Node.js. This is where objects, strings, and closures are stored
For instance, this code:
console.log(process.memoryUsage());
Will return something like this:
{
  rss: 4935680
  heapTotal:1826816
  heapUsed:650472
  External: 49879
}
This shows you how much memory is being consumed by your application. In a production environment, this is not a good method to use because it opens the browser page and shows you the data.
Chrome DevTools
Chrome DevTools can be really helpful in catching and debugging memory leaks. To open the dev tools, open Chrome, click the hamburger icon, select More tools, then click Developer Tools.
Chrome offers a range of tools to help debug your memory and performance issues.
These tools include allocation timelines, sampling heap profiler, and heap snapshots, just to name a few.
To set up Chrome DevTools to debug a Node application, you’ll need:
- The latest version of Node.js
- Your preferred code editor
- The Chrome web browser, of course
Open your Node project on your terminal and type node --inspect

In your browser, type about:inspect. This should open a window like the one below:
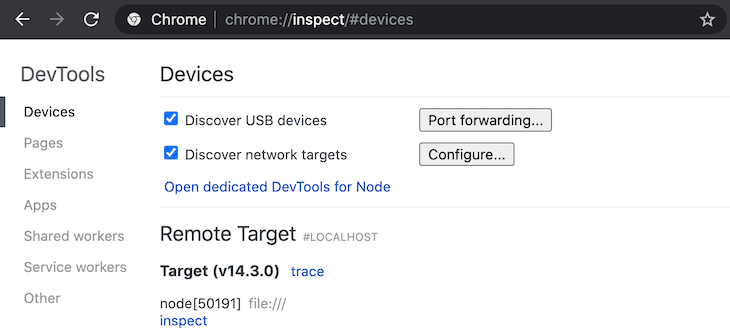
Finally, click on Open dedicated DevTools for Node to start debugging your code.

We shall illustrate an example of this by taking a heap snapshot of the application’s performance in the next section.
Heap snapshots
Heap snapshots are an effective way to debug leaks in a production environment. They allow developers to record the heap and analyze them later with the Chrome DevTools heap profiler.
However, note that this approach has a potential downside since it could trigger a latency spike. Taking heap snapshots can be expensive because we have to do a complete garbage collection after every snapshot.

Optimizing against memory leaks
We all care about performance and keeping our pages fast, making sure that we are using just the minimum amount of memory necessary. Memory profiling can be fun, but at times, it feels like a black box.
It’s hard to avoid memory leaks because you can’t really understand how your objects will be used over time. However, there are ways to mitigate memory leaks in a Node.js application. Below are common pitfalls that developers fall into when writing applications.
Keep an eye on lasting references to DOM elements
JavaScript objects to DOM object references are excellent until the DOM object links back to such a JavaScript object, forming a reference cycle. This becomes problematic, especially in long-running apps since memory is not being released from the cycled objects, thereby causing a memory leak. To ensure there is no direct reference from DOM elements to the real event handler, you should indirect event handlers through an array.
Avoid circular object references
Circular referencing means that an object calls itself, creating a loop. This bounds the object to live forever, which could eventually lead to a memory leak.
Here’s an example of an object referencing itself:
var obj = {}
obj.a = a;
var obj is an empty object, and a is a property that back-references to the same object.
Normally, when this happens, the object references itself, hence forming a circular loop. This can be problematic at times because what we’ve basically done is bind this function to exist forever because as long as the global variables exist, so does the local variable.
This type of behavior would cause a memory leak that would be impossible to fix. The best way is to just get rid of object references.
Unbind event listeners
Binding too many elements makes an application much slower. Take, for instance, this test case created by Andrew Markham-Davies on jsperf. The first event is bound to many elements, thereby making the function slower despite it being one event that is being bound in each case.
In the second scenario, the event is bound to a parent element and assigns an ID to listen to the elements. This makes it more efficient because it targets the element with an ID and not a class, thereby making it faster.
Manage local cache
The cache stores data for faster and easier retrieval when it’s needed later. When computations are slow, caching can be a good way to improve performance. The memory-cache module could be a good tool for in-memory caching in your Node.js applications. You just have to download the dependency and use it in your Node application.
Conclusion
It’s hard to avoid memory leaks because some programs increase their memory footprint as you run them. The key insight is understanding the expected object’s lifetime and learning how to use the tools available to effectively mitigate memory leaks.
You want to be prepared when there are memory leaks, especially in a production environment. You got this far with the tutorial, and I figured I should appreciate your zeal to learn. All the best in your leak hunt!
200's only ✅: Monitor failed and show GraphQL requests in production
While GraphQL has some features for debugging requests and responses, making sure GraphQL reliably serves resources to your production app is where things get tougher. If you’re interested in ensuring network requests to the backend or third party services are successful, try LogRocket.

LogRocket is like a DVR for web apps, recording literally everything that happens on your site. Instead of guessing why problems happen, you can aggregate and report on problematic GraphQL requests to quickly understand the root cause. In addition, you can track Apollo client state and inspect GraphQL queries' key-value pairs.
LogRocket instruments your app to record baseline performance timings such as page load time, time to first byte, slow network requests, and also logs Redux, NgRx, and Vuex actions/state. Start monitoring for free.
The post Understanding memory leaks in Node.js apps appeared first on LogRocket Blog.

Top comments (1)
Great article, I was in search of this
Thanks, Man
Keep writing...