
Written by Ayooluwa Isaiah ✏️
The Visual Studio Code editor has all the tools to debug Node.js applications effectively. Its built-in debugger can debug any application that targets the Node.js runtime, even if the source code for the application is a language that transpiles to JavaScript, such as TypeScript.
When beginning a debugging session, you must inspect the call stack and any scoped variables in their current state. You can also evaluate expressions in the editor and step through the code to drill into the problematic parts.
Setting up a project for Node.js debugging is not particularly difficult, and this tutorial will help you get it right on the first try!
Prerequisites
Before beginning, ensure the most recent versions of both Node.js and Visual Studio Code are installed. This tutorial uses v16.2.0 and 1.56.2, respectively.
You also need a Node.js project; you can use your own or download this sample URL shortener application. The instructions to set it up are in the project's README file.
Start a debugging session in Visual Studio Code
The easiest way to start a debugging session in Visual Studio Code is to open a file in the editor, click the Run View icon in the Activity Bar (or press Ctrl+Shift+D on your keyboard), followed by the Run and Debug button at the top left corner of the application.
The Visual Studio Code debugger will try to auto-detect the debug environment for your project, but if this fails, you will be prompted to select the appropriate environment; in this case, select Node.js.

The Node.js (legacy) option refers to the old JavaScript debugger, which is still available but not recommended.
After selecting an environment, the project launches and the debugger attaches to the process. You can see the output of your project in the DEBUG CONSOLE, and the debug toolbar appears at the top of the screen to step through the code, pause the script, or end the session.
On the left-hand side of the editor, there are five panes titled VARIABLES, WATCH, CALL STACK, LOADED SCRIPTS, and BREAKPOINTS.

You also can create a launch configuration file for the project to configure and save debugging setup details that are infinitely reusable by anyone working on the project. This configuration file is saved as launch.json in the .vscode folder at the root of the project.
Create the configuration file by clicking the create a launch.json file link in the RUN AND DEBUG: RUN view.

After selecting the environment for your project, the launch.json file should appear in the editor with the following contents:
// .vscode/launch.json
{
    "version": "0.2.0",
    "configurations": [
        {
            "type": "pwa-node",
            "request": "launch",
            "name": "Launch URL Shortener",
            "skipFiles": [
                "<node_internals>/**"
            ],
            "program": "${workspaceFolder}/src/server.js"
        }
    ]
}
The name of the configuration is how it will be identified in the Configurations menu; the program that will run is specified in the program field.
There are many options that can be set on each configuration, such as the arguments to pass to the program, environment variables, and pre-debugging tasks. Read the documentation to find out which settings are relevant to your project.
Once you've finished setting up the project configuration, select and execute through the Configuration dropdown menu.
Attach an External Node.js process
Another option to begin a debugging session is attaching to an external Node.js process. Start the program with the following command:
$ node --inspect src/server.js
Or, if you want the debugger to attach before the program starts running, add:
$ node --inspect-brk src/server.js
After executing either of the above commands, you can open a process picker within Visual Studio Code, which lists all the processes that are available to the Node.js debugger. To open the process picker, type Ctrl+Shift+P and find the Debug: Attach to Node Process command:

This opens a menu that lists each individual Node.js process running on your machine. There may be several entries, but it should be easy enough to select the one you are interested in.
Select the relevant entry to start the debugging session.

Creating a breakpoint
Breakpoints allow you to pause the code execution on a specific line to inspect it. You can create breakpoints in Visual Studio Code almost anywhere except function declaration statements. You are not restricted from doing so on variable declarations, expressions, comments, and blank lines.
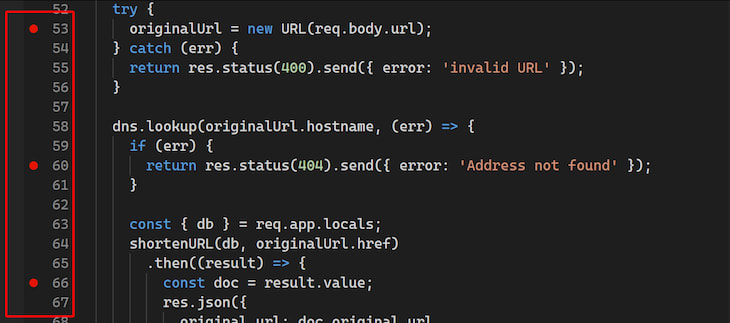
Create a breakpoint by clicking the gutter to the left of the line numbers in the editor. As you move your mouse across the numbers, a red circle appears on each line. Clicking the red circle on a line causes it to turn bright red, indicating that an active breakpoint is present on that line.
You can repeat this for all the lines in your program that are relevant to the problem you're trying to solve.
When you create a breakpoint in the handler for a route, for instance, you can trigger it by executing that part of the code by making a request to the route using the browser or tools like Postman or curl.
This causes the program to stop executing, and you can inspect the values of any current scope identifier in the VARIABLES pane by hovering on the line of the current breakpoint that’s highlighted in yellow. This is similar to the JavaScript debugger in web browsers.

In the BREAKPOINTS pane, all the breakpoints that are enabled in your project are available. You can edit or disable any breakpoint from there, which is helpful if you have several breakpoints across different files in your application.
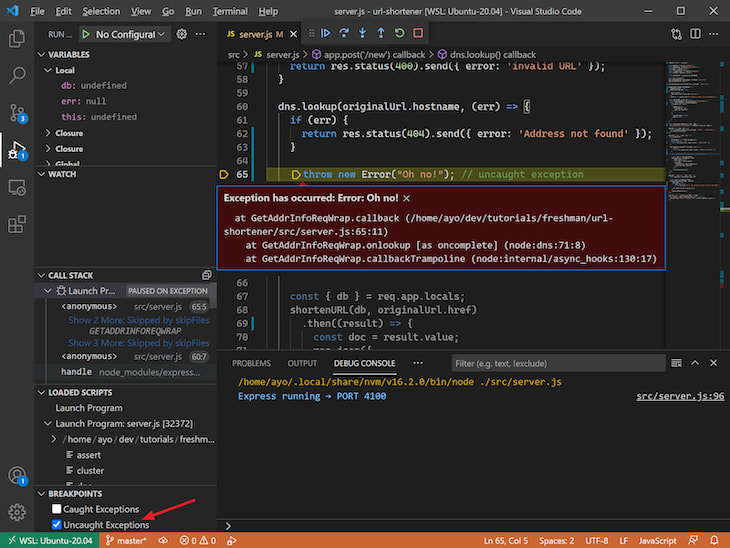
You can also break on all exceptions that occur in your application or uncaught exceptions only. In the latter case, this means the debugger pauses before the error message prints, and you can inspect what may have gone wrong before the process exits.
A variant of breakpoints that is useful for the debugging workflow is the logpoint, which logs a message or value to the console instead of pausing the code execution and breaking into the debugger.
Think of it as a more sophisticated console.log() statement that is easy to add and remove without editing the code itself. It is represented by a red diamond-shaped icon in place of the red circle.
Set a logpoint by right-clicking the gutter and selecting Add Logpoint. This brings up an input field where you can log text to the console. If you want to log the value of an expression or a variable, place it within curly brackets.

Inspecting values
Let's take a deeper look at how you can inspect values in your program as it runs. The main aspects the editor pays attention to are the VARIABLES and WATCH panes.

VARIABLES pane
The VARIABLES pane is where you can inspect the values of variables and expressions that were evaluated at the breakpoint. If you open the context menu by right-clicking on any of the values listed, you can perform a few actions on the variable:
- Set Value lets you modify the variable's value to test certain values while code is executing
- Copy Value copies the value of a variable to the clipboard
- Copy as Expression copies an expression to access the variable
- Add to Watch adds the variable to the WATCH pane for monitoring
WATCH pane
The main benefit of the WATCH pane is that you can easily bring values that you want to monitor into view while the code is paused.
Instead of digging through a deeply nested property in the VARIABLES pane each time you want to check its value, you can add it to the WATCH pane for easy access. This is most useful when determining the values of several variables at once since they are automatically recalculated in the execution.

Tracing the path of code execution
The debug toolbar at the top of the editor provides several commands to navigate through the debugger efficiently. When you're trying to find the path the program took to get to a specific line or function, these features prove invaluable.

Continue (F8)
When the program halts at a breakpoint, you can use this button to resume the execution of the code until the next breakpoint, if any.
Step Over (F10)
This command executes the currently highlighted line and pauses before the next line executes. You can run the command to move down a function and fully understand it’s executed in the process.
If you use this command on a line that calls a function, it executes the entire function and pauses at the line underneath the function call.
Step Into (F11)
The Step Into command works just like Step Over, except when it hits a function call, it enters the invoked function and pauses on the first line. This is a useful way to move from one place to another in your codebase without skipping any details.
Step Out (Shift+F11)
This command continues the execution and pauses at the last line of the current function. This can be used if you accidentally enter a function that is not relevant to the problem you're attempting to solve.
This command helps you get out of that function and back to the relevant bits quickly.
Restart (Ctrl+Shift+F5)
Use this to reset the debugger instead of killing and launching it again.
Stop (Shift+F5)
When you're done debugging a program, use this command to exit the debugging session. If you attach to an external Node.js process, an icon appears to disconnect from the process instead.
Debugging TypeScript with source maps
Many Node.js projects are now written in TypeScript, which can also be debugged with Visual Studio Code.
To begin, enable sourceMap in your tsconfig.json file:
{
  "compilerOptions": {
    "sourceMap": true
  }
}
Once enabled, attach to the running process and set breakpoints in your TypeScript file. Visual Studio Code searches the entire project for source maps, excluding the node_modules folder.
You can use the outFiles attribute in your launch configuration file to specify the exact location where Visual Studio Code must look for source maps; this should be the location of the JavaScript output:
{
    "version": "0.2.0",
    "configurations": [
        {
            "type": "pwa-node",
            "request": "launch",
            "name": "Launch TypeScript",
            "skipFiles": [
                "<node_internals>/**"
            ],
            "preLaunchTask": "compile",
            "program": "${workspaceFolder}/src/server.ts",
            "outFiles": ["${workspaceFolder}/dist/**/*.js"]
        }
    ]
}
If you're using ts-node to run your project without a build step, the process is simpler. Instead of using the launch.json configuration above, use the following:
{
    "version": "0.2.0",
    "configurations": [
        {
            "type": "pwa-node",
            "request": "launch",
            "name": "Launch Server",
            "skipFiles": [
                "<node_internals>/**"
            ],
            "runtimeArgs": [
                "-r",
                "ts-node/register"
            ],
            "args": [
                "${workspaceFolder}/src/server.ts"
            ]
        }
    ]
}
There is no program attribute, so runtimeArgs registers ts-node as the handler for TypeScript files, and the first argument to args is the entry file for the program. Once this is set up, you can start a debugging session!

Conclusion
In this tutorial, we've addressed many of the important aspects of debugging Node.js projects in Visual Studio Code. For more information on all the features that the debugger offers, refer to the online documentation.
Thanks for reading, and happy debugging!
200’s only ✔️ Monitor failed and slow network requests in production
Deploying a Node-based web app or website is the easy part. Making sure your Node instance continues to serve resources to your app is where things get tougher. If you’re interested in ensuring requests to the backend or third party services are successful, try LogRocket.

LogRocket is like a DVR for web apps, recording literally everything that happens on your site. Instead of guessing why problems happen, you can aggregate and report on problematic network requests to quickly understand the root cause.
LogRocket instruments your app to record baseline performance timings such as page load time, time to first byte, slow network requests, and also logs Redux, NgRx, and Vuex actions/state. Start monitoring for free.


Top comments (0)